Article Text

Abstract
Background: The pattern of energy expenditure during sustained high-intensity exercise is influenced by several variables. Data from athletic populations suggest that a pre-exercise conceptual model, or template, is a central variable relative to controlling energy expenditure.
Aims: The aim of this study was to make systematic observations regarding how the performance template develops in fit individuals who have limited specific experience with sustained high-intensity exercise (eg, time trials).
Methods: The study was conducted in four parts and involved measuring performance (time and power output) during: (A) six 3 km cycle time trials, (B) three 2 km rowing time trials, (C) four 2 km rowing time trials with a training period between trials 2 and 3, and (D) three 10 km cycle time trials. All time trials were self-paced with feedback to the subjects regarding previous performances and momentary pace.
Results: In all four series of time trials there was a progressive pattern of improved performance averaging 6% over the first three trials and 10% over six trials. In all studies improvement was associated with increased power output during the early and middle portions of the time trial and a progressively greater terminal rating of perceived exertion. Despite the change in the pattern of energy expenditure, the subjects did not achieve the pattern usually displayed by athletes during comparable events.
Conclusions: This study concludes that the pattern of learning the performance template is primarily related to increased confidence that the trial can be completed without unreasonable levels of exertion or injury, but that the process takes more than six trials to be complete.
Statistics from Altmetric.com
The pattern of power output during self-paced exercise has been suggested to be regulated in an anticipatory manner, the “anticipatory feedback-RPE model.”1 This pattern has been observed in our previous results2 3 4 5 and elsewhere,6 7 8 9 10 is resistant to change11 and, when forced to change, is associated with performance decrements.12 13 During repeated sprint exercise, this anticipated regulation is less evident14 Other studies have shown that humans adjust muscle power output during prolonged exercise based on sensory feedback derived from progressively fatiguing muscles, irrespective of previous competitive experience.15 16 17 18 Given the importance of the apparently preprogrammed performance template to the anticipatory feedback RPE model,1 there are surprisingly limited systematically collected data regarding how this template develops, how it relates to practice patterns and the number of trials required for a stable template to develop. Accordingly, the purpose of this study was to observe the pattern of power output and performance with successive exercise bouts in different groups of well-trained individuals, during different types of exercise, and with reference to the effects of training.
Methods
All subjects provided written informed consent, and the individual protocols were approved by the university human subjects committee. In all studies the subjects were very fit via other elements of their lifestyle (>5 h/week of aerobic exercise) but uniformly had little experience with cycling or rowing time trials. Data on the subjects are provided in table 1.
Characteristics (mean (SD)) of the subjects
The study was conducted in four parts. In Part A, the response to six 3 km cycle time trials was observed with reference to the pattern of power output. In Part B, the responses to three 2 km rowing ergometer trials was observed. In Part C, the effect of rowing practice on the power output pattern during four 2 km rowing ergometer trials was observed. In Part D, the response of recreational level cycle competitors was observed during three 10 km cycling time trials.
In Part A, subjects performed incremental cycle ergometer exercise to document fitness, habituate the subjects and determine whether fitness improved as a result of the repeated time trials. The exercise protocol involved 3 min at a power output of 25 W +25 W per minute until the subject could not maintain a pedalling rate within 60–90 rpm. Respiratory gas exchange data were measured using open-circuit spirometry (AEI, Pittsburgh, Pennsylvania). Ventilatory (VT) and respiratory compensation (RCT) thresholds were determined according to standard methods.19 Heart rate (HR) was measured using radio telemetry. Between incremental tests, the subjects performed six 3 km cycle time trials on an electronically braked racing cycle ergometer (Racer Mate, Seattle, Washington) with 48–96 h of light exercise between ttials. Prior to each time trial (in this and all other parts of the study), the subject performed a standard 10 min warm-up, with the first 2 min at 25 W, the next 3 min at a power output calculated to require ∼75% of the VO2 at VT and the last 5 min at a power output calculated to require ∼90% of the VO2 at VT. Following the warm-up, the subject rested for 2 min before beginning the time trial. To prevent excessive starting forces on the ergometer frame, 30 s before the beginning of the time trial the subject began pedalling at 25 W. At the beginning of the time trial, the subject was instructed to “begin racing” with the only instruction being to complete the 3 km as quickly as possible. During the trial, the subject had feedback from the ergometer display, including velocity, power output, HR and distance completed. During the trial, the subject rated their level of exertion using the category ratio (0–10) Rating of Perceived Exertion scale20 after each 300 m. After the trials, the data were averaged based on the time required to complete each 300 m (eg, 10% of total distance).
In Part B, the subjects performed an incremental test on a wind-braked rowing ergometer (Concept II, Morrisville, Vermont) for characterisation. The initial power output was 0.5 W × body weight in kg, and was incremented by this amount each minute until fatigue. Respiratory gas exchange was performed using open-circuit spirometry as described above. Subsequently, each subject performed three 2 km time trials on the rowing ergometer, with 48–96 h between trials. Other than to finish as quickly as possible, the subjects were given no instructions. Each subject was informed of their preceding best performance and had full access to information about distance completed and momentary pace (eg, 500 m split) from the ergometer display. The data were averaged and analysed every 200 m (eg, 10% distance).
In Part C, the subjects performed incremental testing for habituation and characterisation, as in Part B. Subsequently, each subject performed two 2 km time trials on the rowing ergometer, with no instructions other than to finish in the shortest possible time. During the next month, the subjects performed two rowing training sessions per week (total = 8), with one training session being continuous and one interval, with a total distance of 4–6 km. Specific instructions about rowing technique were not provided. However, the subjects were informed that the goal of the training was to allow them to improve their performance for subsequent time trials. Following this training, they performed two additional 2 km rowing time trials. The subjects had access to their previous performances, momentary distance completed and momentary pace from the ergometer display. Data were averaged every 200 m.
In Part D, the subjects performed a preliminary incremental exercise as in Part A. Subsequently, they performed three 10 km time trials on an electrically braked cycle ergometer (Racer Mate, Seattle, Washington). Other than the instruction to finish as rapidly as possible, no instructions were provided, although the subject knew their maximal power output from the preliminary test and had access to distance, velocity, power output and HR, just as they would during competition. Blood lactate concentration was measured in fingertip capillary blood (YSI Sport, Yellow Springs, Ohio) before the beginning of the time trial (after the warm-up) and at the completion of each 2 km of the time trial. Other data were averaged for every 1 km of the ride (eg, 10% of the total distance).
Statistical analyses were performed for all studies using repeated-measures ANOVA. Post-hoc analyses were performed when indicated by ANOVA using the Tukey procedure. Statistical significance was accepted when p<0.05.
Results
In Part A, the six 3000 m cycle trials were completed in 337 (SD 63), 321 (61). 317 (63), 310 (58), 306 (57) and 303 (56) s, respectively. Except for T5 vs T6, each trial was significantly faster than the preceding one. Together with the time results of the other parts of the study, performance time normalised to the first performance is presented in fig 1. The sequential pattern of total power output and RPE in Part A is presented in fig 2. There was a significant trials×distance interaction for power output. This was characterised by a progressively greater power output during the first half of successive trials, with non-significant differences during the last half of each trial. During the first 1 km, there was a perfect sequential pattern with each subsequent trial having a higher power output than during the preceding trial. In concert with this, there were no significant differences in total power output during the last 300 m of any trial. There was a significant distance×trials interaction for RPE. Although less clear than for power output, the differences can be characterised as a lower RPE during the beginning and middle parts of the early trials, with small but still statistically significant differences in the terminal RPE (8.4 (0.4), 8.6 (0.5), 8.8 (0.6), 8.8 (0.9), 9.1 (0.6) and 9.3 (0.6), respectively).
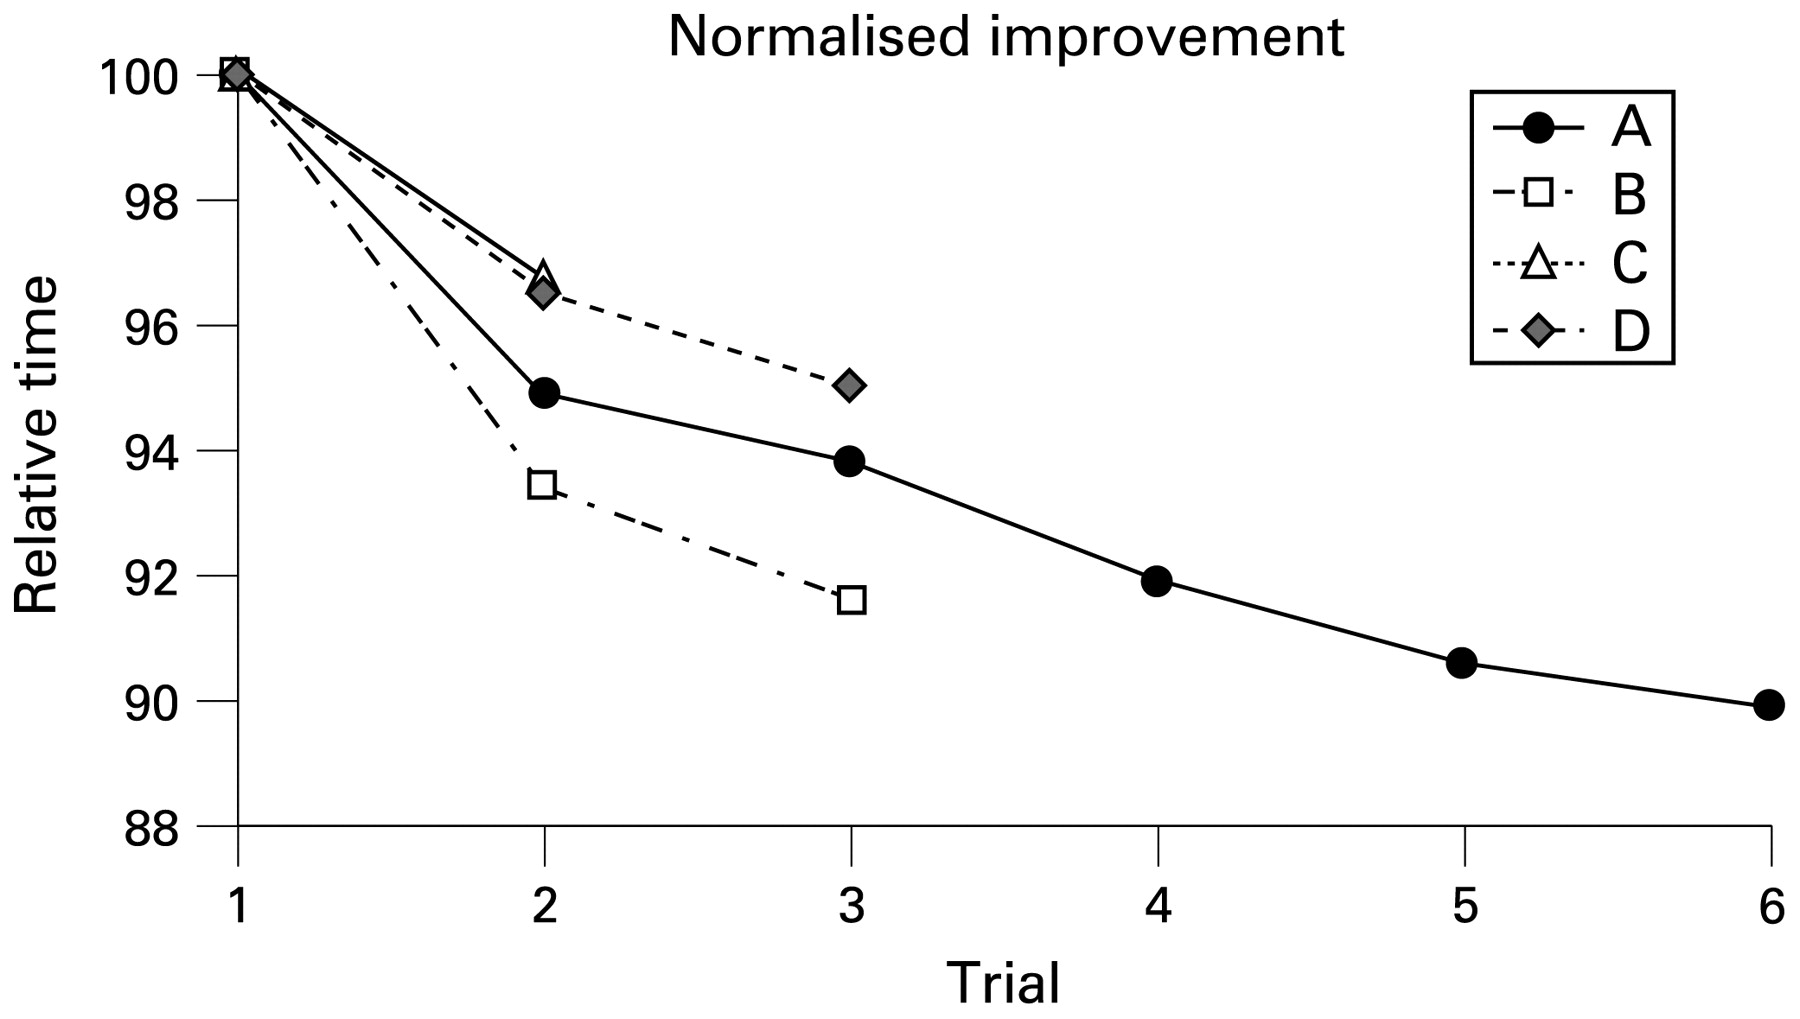
Changes in performance time, normalised to the first performance in the four series of experiments. In Part C, only the first two rowing time trials were included, as there was an intervening period of training between trials 2 and 3.

Serial pattern of power output (top) and RPE (bottom) during the six trails of Part A. Note the progressively higher power output during the first 600 m of the ride during the successive trails and the progressively higher RPE at the same point in the ride during successive trials.
In Part B, the three 2 km rowing trials were completed in 583 (84), 543 (68) and 532 (68) s, respectively. Each sequential performance was significantly faster than the preceding one. The sequential pattern of power output per 200 m is presented in fig 3 and was characterised by a higher power output in the first half of successive trials, with minimal differences during the last portion of the trial. The RPE at the conclusion of successive trials was 5.8 (1.3), 6.8 (1.6) and 6.9 (1.4), respectively, with the terminal RPE of T1 significantly less than of T2 and T3.

Serial pattern of power output during the three rowing time trials in Part B. Note the higher power output during the early portion of the trial during successive trials, with comparatively small differences in power output during the terminal portion of the trial.
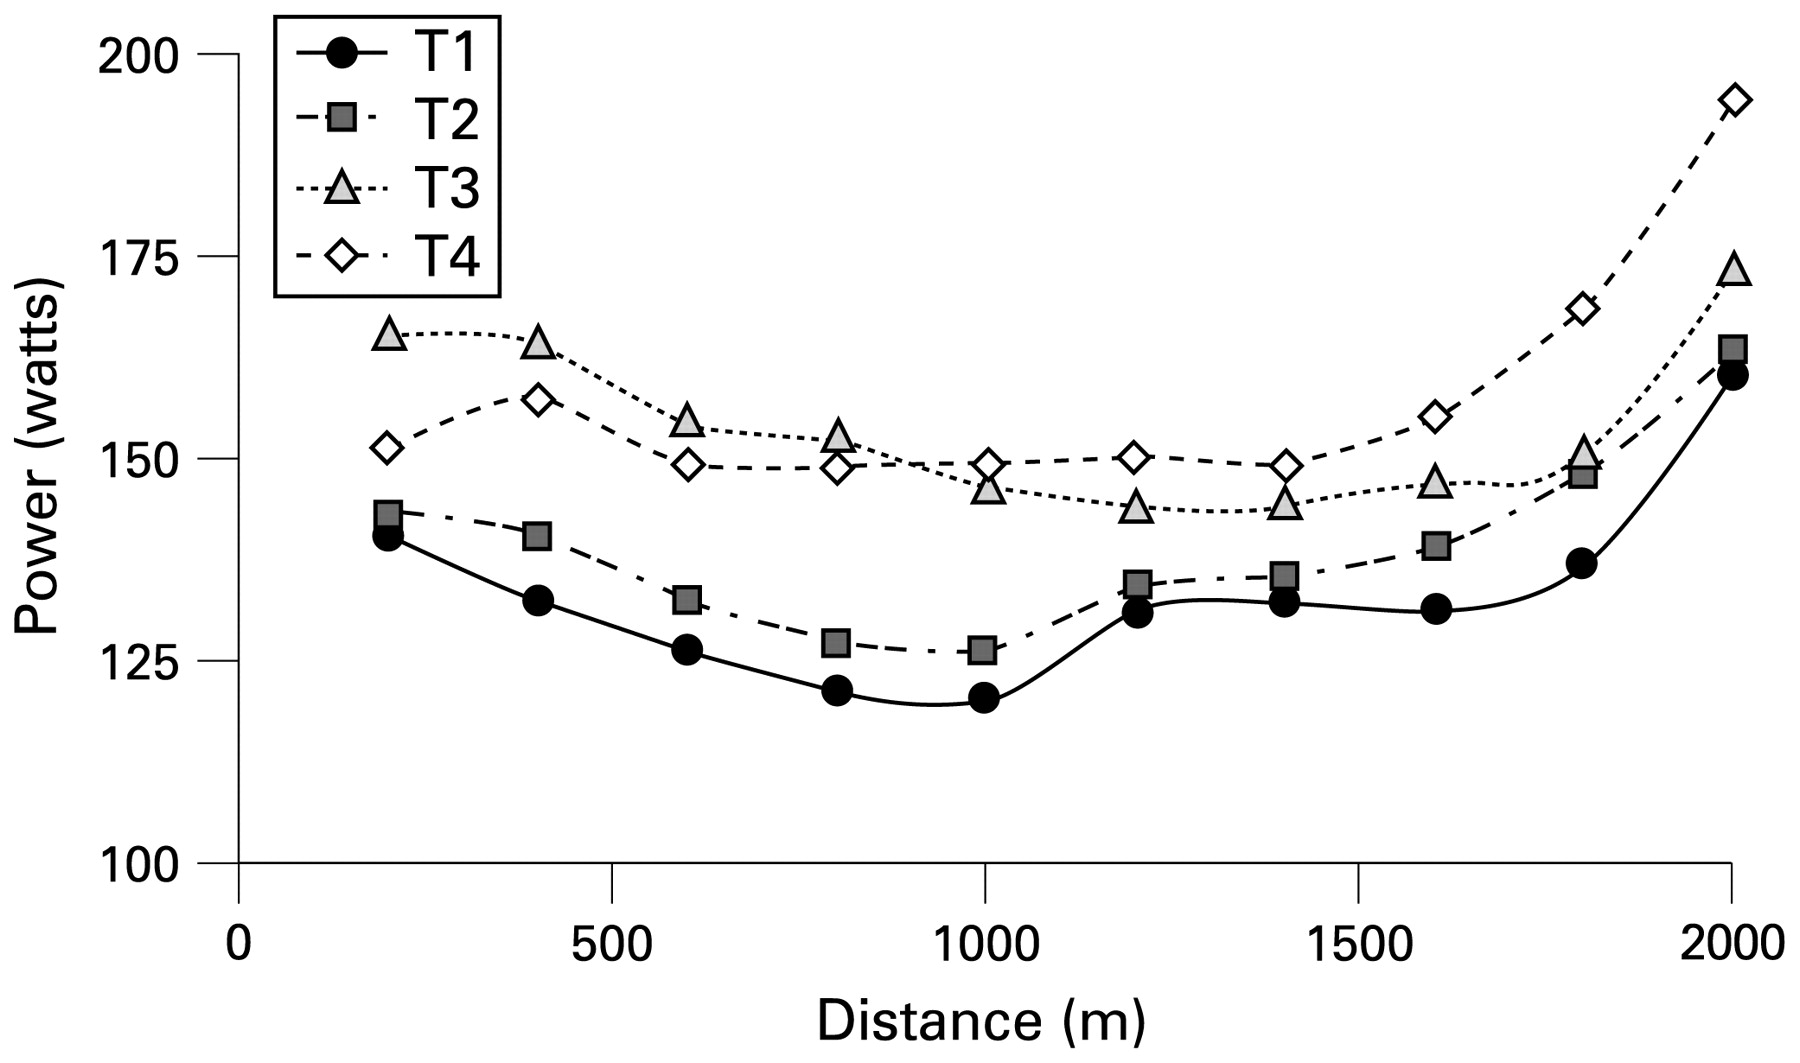
In Part C, the four 2 km rowing ergometer trials were completed in 606 (144), 583 (118), 546 (88) and 540 (83) s, respectively. The time difference between all trials except T3 and T4 was significant. The pattern of power output integrated every 200 m over successive trials is presented in fig 4 and was characterised by progressively higher power output during the early part of successive trials. The RPE at the conclusion of successive trials was 6.0 (1.2), 6.6 (1.7), 7.5 (1.4) and 7.7 (1.3), respectively, with the RPE in T1 significantly less than T2, and T1 and T2 significantly less than T3 and T4. There was a significant effect across the training period, but with minimal differences in pacing strategy between T3 and T4.

Serial pattern of power output during the four rowing time trails in Part C. Note the higher early power output in successive trails with minimal differences in power output during the terminal portion of the trail.
In Part D, the three 10 km cycle time trials were completed in 1059 (96), 1022 (89) and 1006 (84) s, respectively. Each trial was significant faster than the preceding one. The pattern of power output, HR, RPE and blood lactate is presented in fig 5 and is characterised by a higher power output earlier in sucessive trials, with no differences in terminal power output. From the midpoint of T1 until the finish, the RPE was lower than in T2 and T3. The terminal RPE was lower in T1 (8.5 (1.4)) than in T2 (9.3 (0.8)) and T3 (9.7 (0.7)).

Serial pattern of power output, heart rate, REP and blood lactate concentration in Part D. Note the progressively higher values, particularly of power output and blood lactate concentration during the early portion of the ride during successive trails.
Discussion
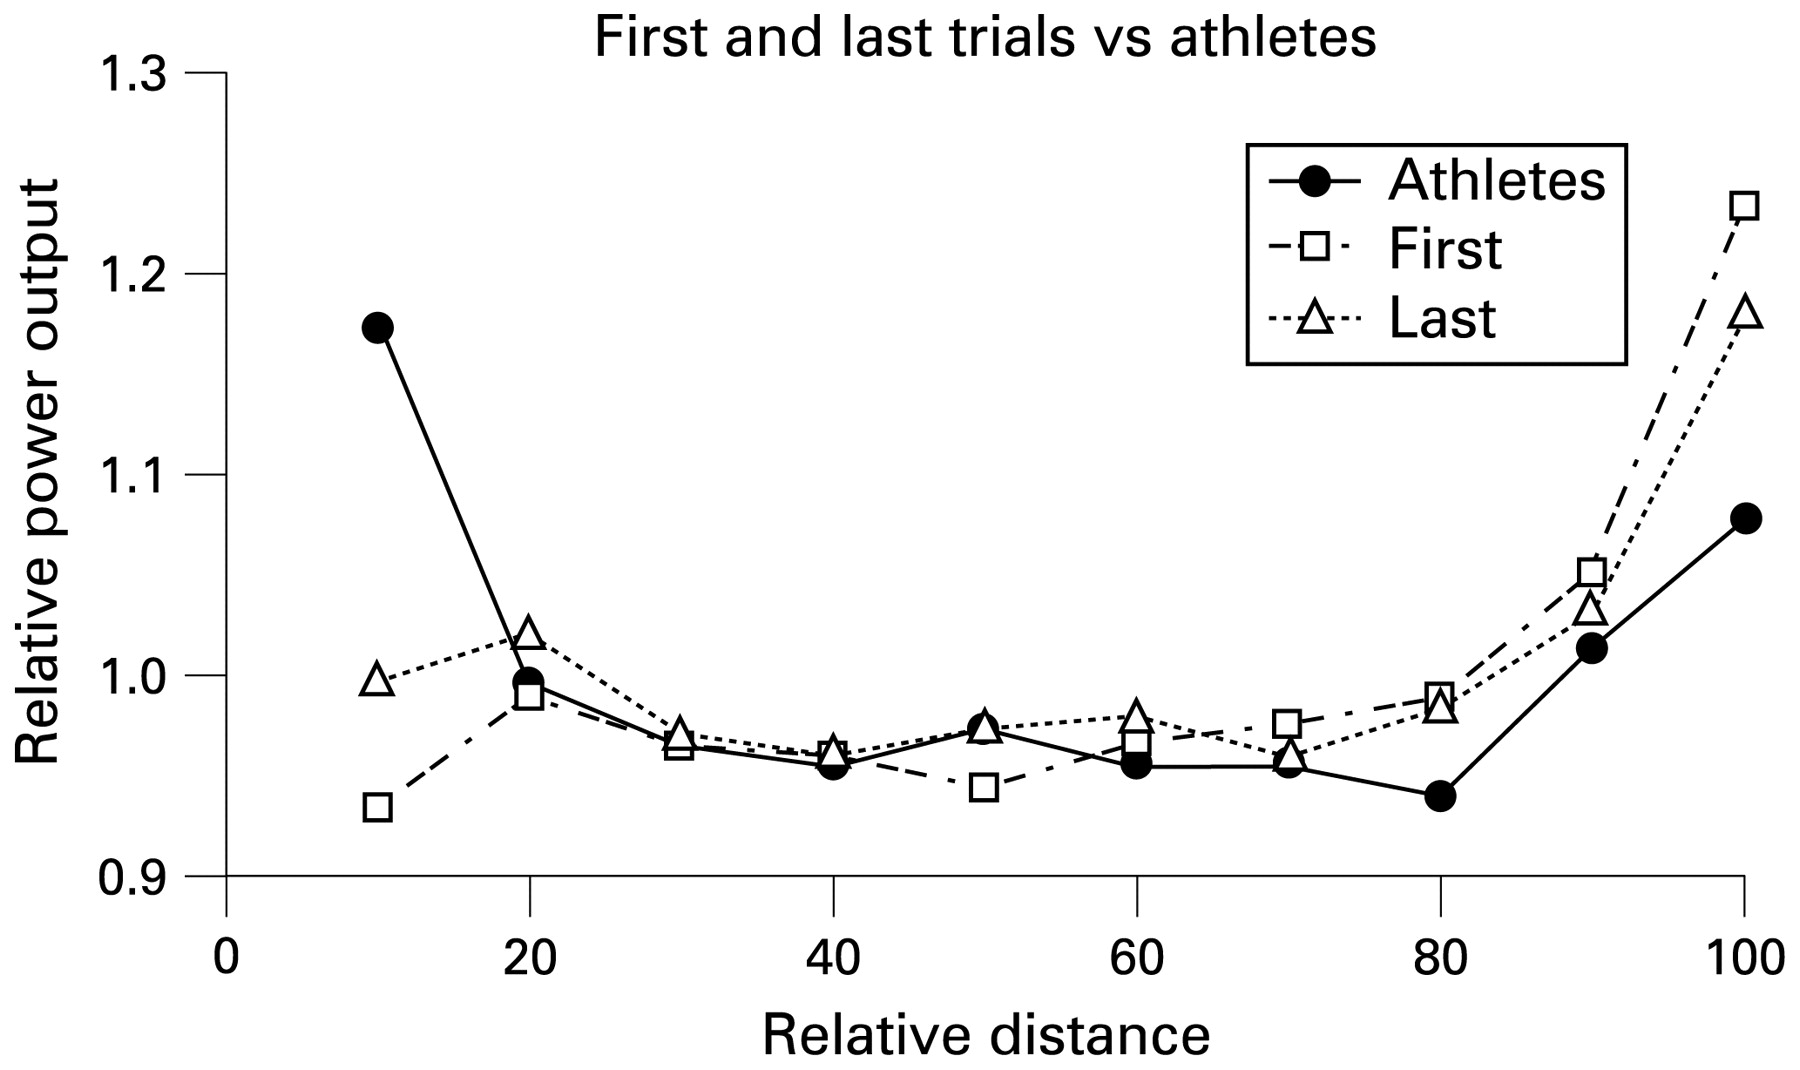
The main finding of this study is the similarity of pattern of acquiring a consistent pacing pattern in four groups of well-trained non-athletes, using two different ergometric modes. In the early trials, the initial power output was reduced during the first portion of the trial, with the power output during the terminal portions of the trial being remarkably consistent. Subsequent trials were marked by a progressively more aggressive early pace, with evidence that an essentially stable performance template was achieved by the third or fourth trial. The pattern of power output during all studies normalised to the mean power output evolved from a low early power and high power output in the terminal portion of the time trials, in the combined results of the first trial, to a higher power during the early portion with more moderate terminal power output (fig 6). While not identical to the very high early power output pattern observed in high level competitive cyclists and speed skaters2 3 4 during events of comparable duration, it was clear that the pattern was evolving in that direction.
Supporting the observation of reductions in power output during beginning portions of the first trials was evidence that the RPE increased more slowly during the first part of the first time trials and that the RPE at the end of the time trials was systematically lower. This trend was further reflected by the pattern of blood lactate accumulation in Part D. Collectively, it can be argued that the subjects were “holding back” during the early trials, and then progressively increased their effort as they became convinced that the time trial could be completed with a particular strategy without negative consequences. This is not unlike the slower speed of completion, designed to reduce errors, typically observed in motor learning tasks.21
Although the subjects were well trained generally, there was no evidence of any training effect during cycling (peak power output in part A was 281 (108) W before T1 and 288 (116) W after T6), and there was a significant improvement in performance across a period of training during the rowing ergometer study (Part C). However, this was reasonably attributable to the effects of practice on this specific ergometric mode and seemed to be associated with the same trend toward a modified pacing strategy (eg, higher early power output) in successive trials.
What is known on this topic
The pattern of energy expenditure during time trail exercise appears to follow a predetermined template, which is modified by a variety of sensory feedback mechanisms.
What this study adds
The pattern of developing the performance template appears to follow a predictable pattern during several repetitions of time trial exercise, characterised by a higher rate of energy expenditure earlier in the event.
In summary, the data from the current series of four studies suggest that there is a learning effect during the performance of successive high-intensity time trials. Although the largest effect is during the first three trials, even after several trials these well-trained subjects do not achieve the pattern of power output typically displayed by athletes. This suggests that the pre-exercise template that is a central feature of the “anticipatory feedback-RPE model” is a non-constant feature and may require some time to fully develop. In this regard, it would be of interest to observe the way in which athletes spontaneously improve their performance, and to determine whether performance improvements are more attributable to increases in total power output or to better optimisation of the pattern of power distribution.
REFERENCES
Footnotes
-
Funding KJH and KP were recipients of Dean’s Summer Research Fellowships at the University of Wisconsin-La Crosse. BR received a research grant from the Graduate Council of the University of Wisconsin-La Crosse.
-
Competing interests None.
-
Ethics approval Ethics approval was provided by University of Wisconsin-La Crosse.
-
Patient consent Obtained.