Article Text

Abstract
Objectives The optimal strategy for soccer teams playing at altitude is not known, that is, ‘fly-in, fly-out’ versus short-term acclimatisation. Here, we document changes in blood gas and vascular volumes of sea-level (Australian, n=20) and altitude (Bolivian, n=19) native soccer players at 3600 m.
Methods Haemoglobin-oxygen saturation (Hb-sO2), arterial oxygen content (CaO2), haemoglobin mass (Hbmass), blood volume (BV) and blood gas concentrations were measured before descent (Bolivians only), together with aerobic fitness (via Yo-YoIR1), near sea-level, after ascent and during 13 days at 3600 m.
Results At baseline, haemoglobin concentration [Hb] and Hbmass were higher in Bolivians (mean±SD; 18.2±1.0 g/dL, 12.8±0.8 g/kg) than Australians (15.0±0.9 g/dL, 11.6±0.7 g/kg; both p≤0.001). Near sea-level, [Hb] of Bolivians decreased to 16.6±0.9 g/dL, but normalised upon return to 3600 m; Hbmass was constant regardless of altitude. In Australians, [Hb] increased after 12 days at 3600 m to 17.3±1.0 g/dL; Hbmass increased by 3.0±2.7% (p≤0.01). BV decreased in both teams at altitude by ∼400 mL. Arterial partial pressure for oxygen (PaO2), Hb-sO2 and CaO2 of both teams decreased within 2 h of arrival at 3600 m (p≤0.001) but increased over the following days, with CaO2 overcompensated in Australians (+1.7±1.2 mL/100 mL; p≤0.001). Yo-YoIR1 was lower on the 3rd versus 10th day at altitude and was significantly related to CaO2.
Conclusions The marked drop in PaO2 and CaO2 observed after ascent does not support the ‘fly-in, fly-out’ approach for soccer teams to play immediately after arrival at altitude. Although short-term acclimatisation was sufficient for Australians to stabilise their CaO2 (mostly due to loss of plasma volume), 12 days appears insufficient to reach chronic levels of adaption.
- Altitude
- Physiology
- Soccer
- Respiratory
This is an Open Access article distributed in accordance with the Creative Commons Attribution Non Commercial (CC BY-NC 3.0) license, which permits others to distribute, remix, adapt, build upon this work non-commercially, and license their derivative works on different terms, provided the original work is properly cited and the use is non-commercial. See: http://creativecommons.org/licenses/by-nc/3.0/
Statistics from Altmetric.com
Introduction
Playing soccer at altitude presents an interesting dilemma for teams. Following reports of discomfort by several South American soccer federations, Federation Internationale de Football Association (FIFA) banned international games at altitudes above 2500 m in 2007, but after political intervention, the limit was increased to 3000 m and shortly thereafter suspended pending more data. FIFA published a consensus statement in 2008, indicating soccer performance is likely compromised at moderate altitude (2000–3000 m) but that any decrement could be abated within 2 weeks through acclimatisation.1
Until now, very little data existed relating to soccer at altitude, especially above 3000 m. The only available published study on VO2 max of professional soccer players from altitude (La Paz, 3600 m) and near sea-level (Santa Cruz 430 m, both Bolivia) showed a more pronounced decrease in lowlanders when moving from low-land to altitude (3600 m) than in players adapted to altitude.2 The time course of acclimatisation, and hence the optimum preparation strategy, however, is not known. As a consequence of busy match schedules, logistics and monetary constraints, many teams opt for a ‘fly-in, fly-out’ approach, rather than investing in a longer (1–2 week) acclimatisation phase. Additionally, there is some anecdotal belief that if matches are played within the first few hours of arrival at altitude, physical performance will be less compromised.
Regardless of the acclimatisation strategy employed, reduced oxygen availability at altitude, resulting in low arterial partial pressure for oxygen (PaO2) and low arterial oxygen content (CaO2), markedly reduces aerobic performance of players from sea-level.2 Thus, even acute exposure to altitude triggers a multifaceted response. While PaO2 at altitude mostly depends on the degree of hypoxic ventilation, CaO2 is also determined by the position of the oxygen dissociation curve3 and especially by haemoglobin concentration ([Hb])—which in turn depends on the loss of body water and thereby changes in blood and plasma volume (PV), and the erythropoietic response.4 Acutely, changes in ventilation and diuresis appear to be the most important adaptive mechanisms as the increase in haemoglobin mass (Hbmass) is too slow for immediate needs5 ,6 and represents a long-term adaptation. Therefore, the primary aim was to document the time-course and magnitude of changes in CaO2 and the corresponding adaptations of Hbmass, and blood volume (BV) in sea-level native soccer players during 2 weeks of exposure at 3600 m.
Altitude residents descending from altitude to sea-level are characterised by a rapidly occurring water retention leading to increased PV.4 ,7 When these subjects return to altitude after a short sojourn at sea-level, some physiological functions must ‘re-adapt’ (eg, erythropoietin (EPO) secretion), while other functions are able to switch quickly to altitude conditions (eg, ventilation).8 The secondary aim of the study was, therefore, to monitor possible blood gas and vascular volume changes in altitude natives following descent to near sea-level and upon return to altitude. In this respect, altitude natives provide a reference for chronic altitude adaptation, and may provide additional insight into acute responses to altered oxygen availability.
Methods
Participants
Thirty-nine youth soccer players provided written informed consent to participate in the study which was approved by two independent Human Ethics Committees.9 Players consisted of two teams: ‘The Joeys’ Australian U17 National team (n=20) and U20 players from ‘The Strongest’, a professional club based in La Paz (n=19). Australian players were lifetime sea-level residents. Bolivian players were altitude natives, born between 2800 m and 4100 m<stet> and residing in La Paz (3200–4100 m) at the time of the study. The complete study design and participant characteristics are reported in a companion paper.9 Data pertaining to wellness, running performance, activity during matches and sleep architecture are reported in companion papers in this issue.9–13
Serum ferritin was assessed 4 weeks prior to the start of the study. Players with values below <40 μg/L (5 Australians, 4 Bolivians) were immediately supplemented with oral iron daily (305 mg ferrous sulfate). The remaining Australians started supplementation 1 week prior to ascent and continued throughout exposure.
Study design
Both teams trained for 6 days near sea-level (Santa Cruz, Bolivia, 430 m) followed by 13 days of altitude training in La Paz (3600 m). Hbmass, BV, [Hb], haemoglobin-oxygen saturation (Hb-sO2), blood gases and the acid–base status of the Bolivians were measured in La Paz, 4–5 days prior to descent and after 5 days near sea-level. Australian players flew to Santa Cruz where baseline haematological measures were established from duplicate measurements taken 2 and 4 days after arrival. Both teams flew to La Paz on the sixth day, with blood gas measures performed within 2 h of arrival. Hbmass, BV and blood gas measures were performed on days 5 (Bolivians) and 7 (Australians) at altitude and at the end of exposure, with additional blood gas measures performed on day 3 (see figure 1 in our companion paper8). Hbmass was also measured in 10 Australian players 2 weeks later in Canberra, Australia (∼600 m).

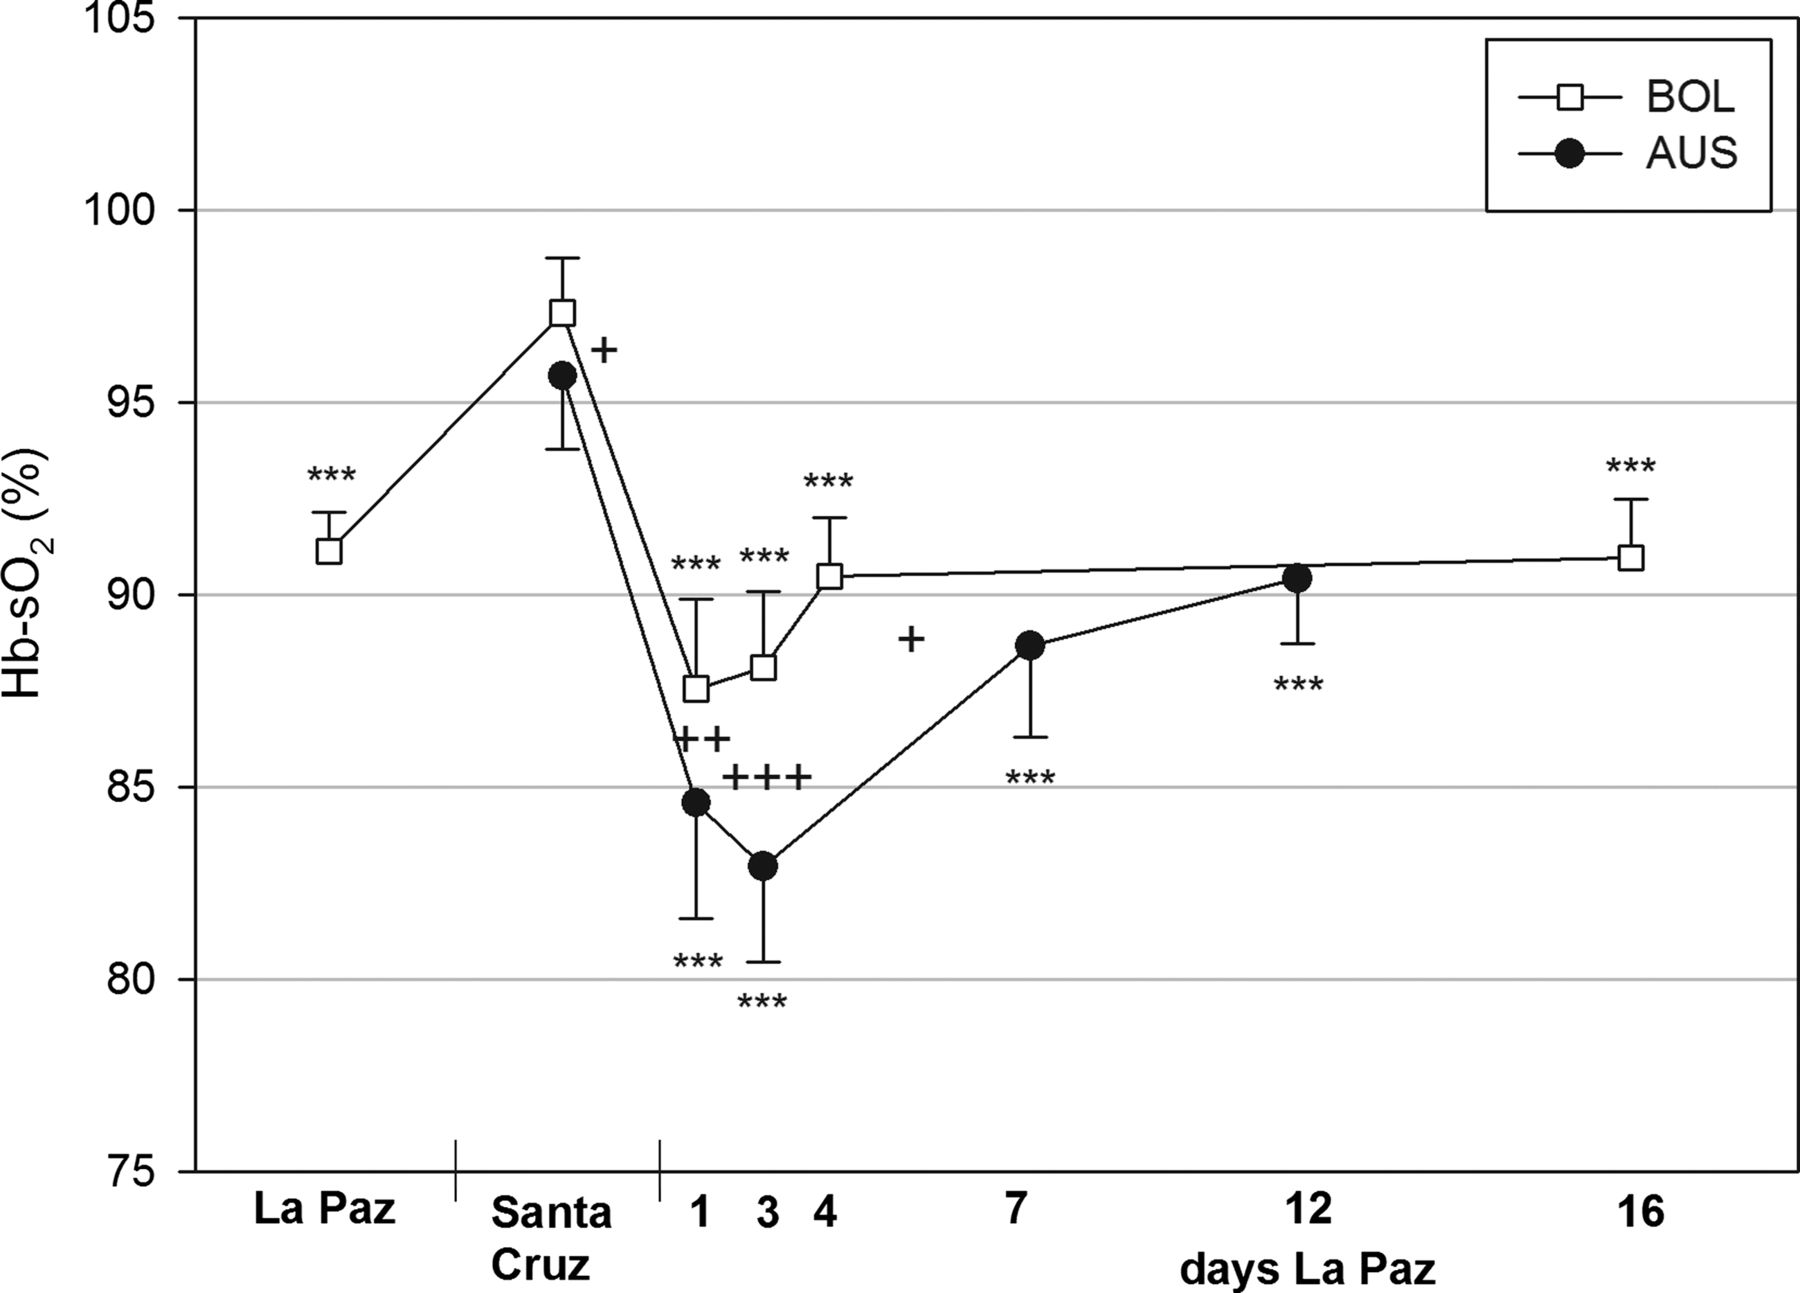
Haemoglobin oxygen saturation (Hb-sO2) in arterialised blood of Australian (AUS) and Bolivian (BOL) soccer players at near sea level and during the 12 day acclimatisation period at 3600 m. *** indicates the group differences from the data at sea level. +++ indicates the significance of differences between both teams (+p<0.05, ++p<0.01, +++p<0.001).
Aerobic fitness was assessed on a grass football pitch on day 2 near sea-level using the Yo-Yo intermittent recovery test level 1 (Yo-YoIR1),14 and repeated on days 3 and 10 at altitude (for a complete description see our companion paper11).
Procedures
Hbmass was measured using the optimised carbon monoxide rebreathing technique.15 A CO bolus of 1.2 mL/kg body mass was rebreathed through a glass spirometer for 2 min. The volume of CO administered at altitude was adjusted according to barometric pressure. Capillary blood was sampled before and 7 min after inhalation and analysed for carboxyhaemoglobin (HbCO) concentration (OSM3, Radiometer, Copenhagen, Denmark). The same analyser was used for all measures in Bolivia. Custom quality controls were analysed to ensure the stability of the analyser,16 and to allow comparison in series with the final measurement in Australia, where a second analyser was used. Since the quality controls were stable, no corrections were performed.
Capillary haemoglobin concentration (c[Hb]) was measured in duplicate using a Hemocue Hb201 System (Cypress, USA) before each rebreathing test after the subjects had been seated for at least 10 min and used to calculate BV. Blood gases (PaO2, PaCO2), Hb-sO2, pH, actual bicarbonate ([HCO3−]) and base excess (BE) were measured from capillary blood (ABL80Flex, Radiometer, Copenhagen, Denmark).
Statistics
Data are presented as mean±SDs. Paired t-test’s including a Bonferroni correction were applied to compare mean within groups and unpaired t-tests were used for a comparison of Australians and Bolivians at corresponding time-points. Linear regression analysis was used to evaluate the dependency of Hb-sO2 on PaCO2 and Yo-YoIR1 distance at altitude on CaO2. A mixed model with Hb-sO2, Hbmass and BV as covariates was calculated to quantify their effects on CaO2 when Bolivians descended to Santa Cruz and after ascent of both teams to La Paz.
Results
PaO2 (table 1) and Hb-sO2 (figure 1) increased in Bolivians near sea-level and decreased in both teams within 2 h of arrival at 3600 m (Hb-sO2; Australians: 84.6±3.0%; Bolivians: 87.6±2.3%; p≤0.001). Both parameters remained low for 3 days, with a greater decrease in Australians, before increasing in the following days (Hb-sO2; Australians: 90.4±1.7%, Bolivians: 91.0±1.5%, p≤0.001).
Arterial oxygen partial pressure (PaO2) and acid-base status in Australian (AUS) and Bolivian (BOL) football players at near sea-level and during 12 days at 3600 m
PaCO2 (table 1) considerably increased in Bolivians near sea-level. Upon ascent, PaCO2 of both teams was unchanged within 2 h of arrival, but was lower at day 3 and continued to drop throughout exposure.
pH decreased in Bolivians after arrival near sea-level, did not change in either team after 3 days at altitude and slightly increased thereafter (table 1). [HCO3−] and BE did not change in Australians 2 h after arrival at altitude and significantly decreased over the following days (table 1). No substantial group differences existed for PaCO2 and pH [HCO3−] and BE decreased slightly faster in Bolivians.
Linear regression analysis showed significant negative relationships between Hb-sO2 and PaCO2 in both groups (figure 2). At identical PaCO2, Hb-sO2 was higher in the Bolivians.

Relationship between haemoglobin oxygen saturation (Hb-sO2) and arterial partial pressure of carbon dioxide (PaCO2) which reflects the degree of hyperventilation. Data are obtained from day 1 to day 12 at altitude (BOL at day 16). During the first days at altitude Hb-O2-saturation is higher in BOL at identical PaCO2. AUS, Australian players, BOL, Bolivian players.
Baseline [Hb] and Hbmass were 15.0±0.9 g/dL and 797±75 g, respectively, in Australians and 18.2±1.0 g/dL and 833±104 g in Bolivians. After descending, near sea-level [Hb] (figure 3A) decreased in Bolivians to 16.7±0.9 g/dL (p<0.001) and after 5 days back at altitude almost reached predescent levels (17.8±0.6 g/dL, p<0.001). In Australians, near sea-level [Hb] was clearly lower vs Bolivians and increased markedly during altitude exposure (17.3±1.0 g/dL, p<0.001). Absolute Hbmass (figure 3B) remained unchanged in Bolivians, but significantly increased in Australians (+25.8 g, p<0.001). Relative Hbmass (figure 3C) was clearly different between both groups at baseline (Australians: 11.5±0.7 g/kg, Bolivians 13.3±0.8 g/kg, p<0.001). Near sea-level relative Hbmass significantly decreased in Bolivians (12.8±0.8 g/kg, p<0.01) but returned to baseline at altitude. In Australians, relative Hbmass significantly increased at altitude (12.3±0.9 g/kg, p<0.001) without achieving the values of Bolivians, and remained elevated in 10 players measured 2 weeks later in Australia.

(A) Haemoglobin concentration, (B) absolute haemoglobin mass (Hbmass), (C) relative haemoglobin mass (rel. Hbmass), (D) blood volume of Australian (AUS) and Bolivian (BOL) players at near sea-level (430) and after ascent to altitude (3600 m).
Before descending, BV (figure 3D) was significantly lower in Bolivians (5306±637 mL, Australians: 6040±503 mL, p<0.01) and increased near sea-level by 518±306 mL to the same level as Australians. At altitude, BV decreased in both groups by >400 mL (Bolivians at day 5 5395±683 mL, Australians at day 12: 5608±621 mL, p<0.001).
In Bolivians, CaO2 (figure 4) only slightly dropped after descent (22.5±1.3 mL/dL) and remained significantly higher vs Australians (20.0±1.5 mL/dL). Upon ascent, CaO2 significantly decreased in both teams 2 h after arrival (Australians: 17.7±1.4 mL/dL, Bolivians: 20.3±1.2 mL/dL, p<0.001) and considerably increased the following days achieving baseline values in Bolivians (at day 5: 22.3±1.0 mL/dL) and showing a significant overcompensation in Australians (at day 12: 21.8±1.4 mL/dL, p<0.001).
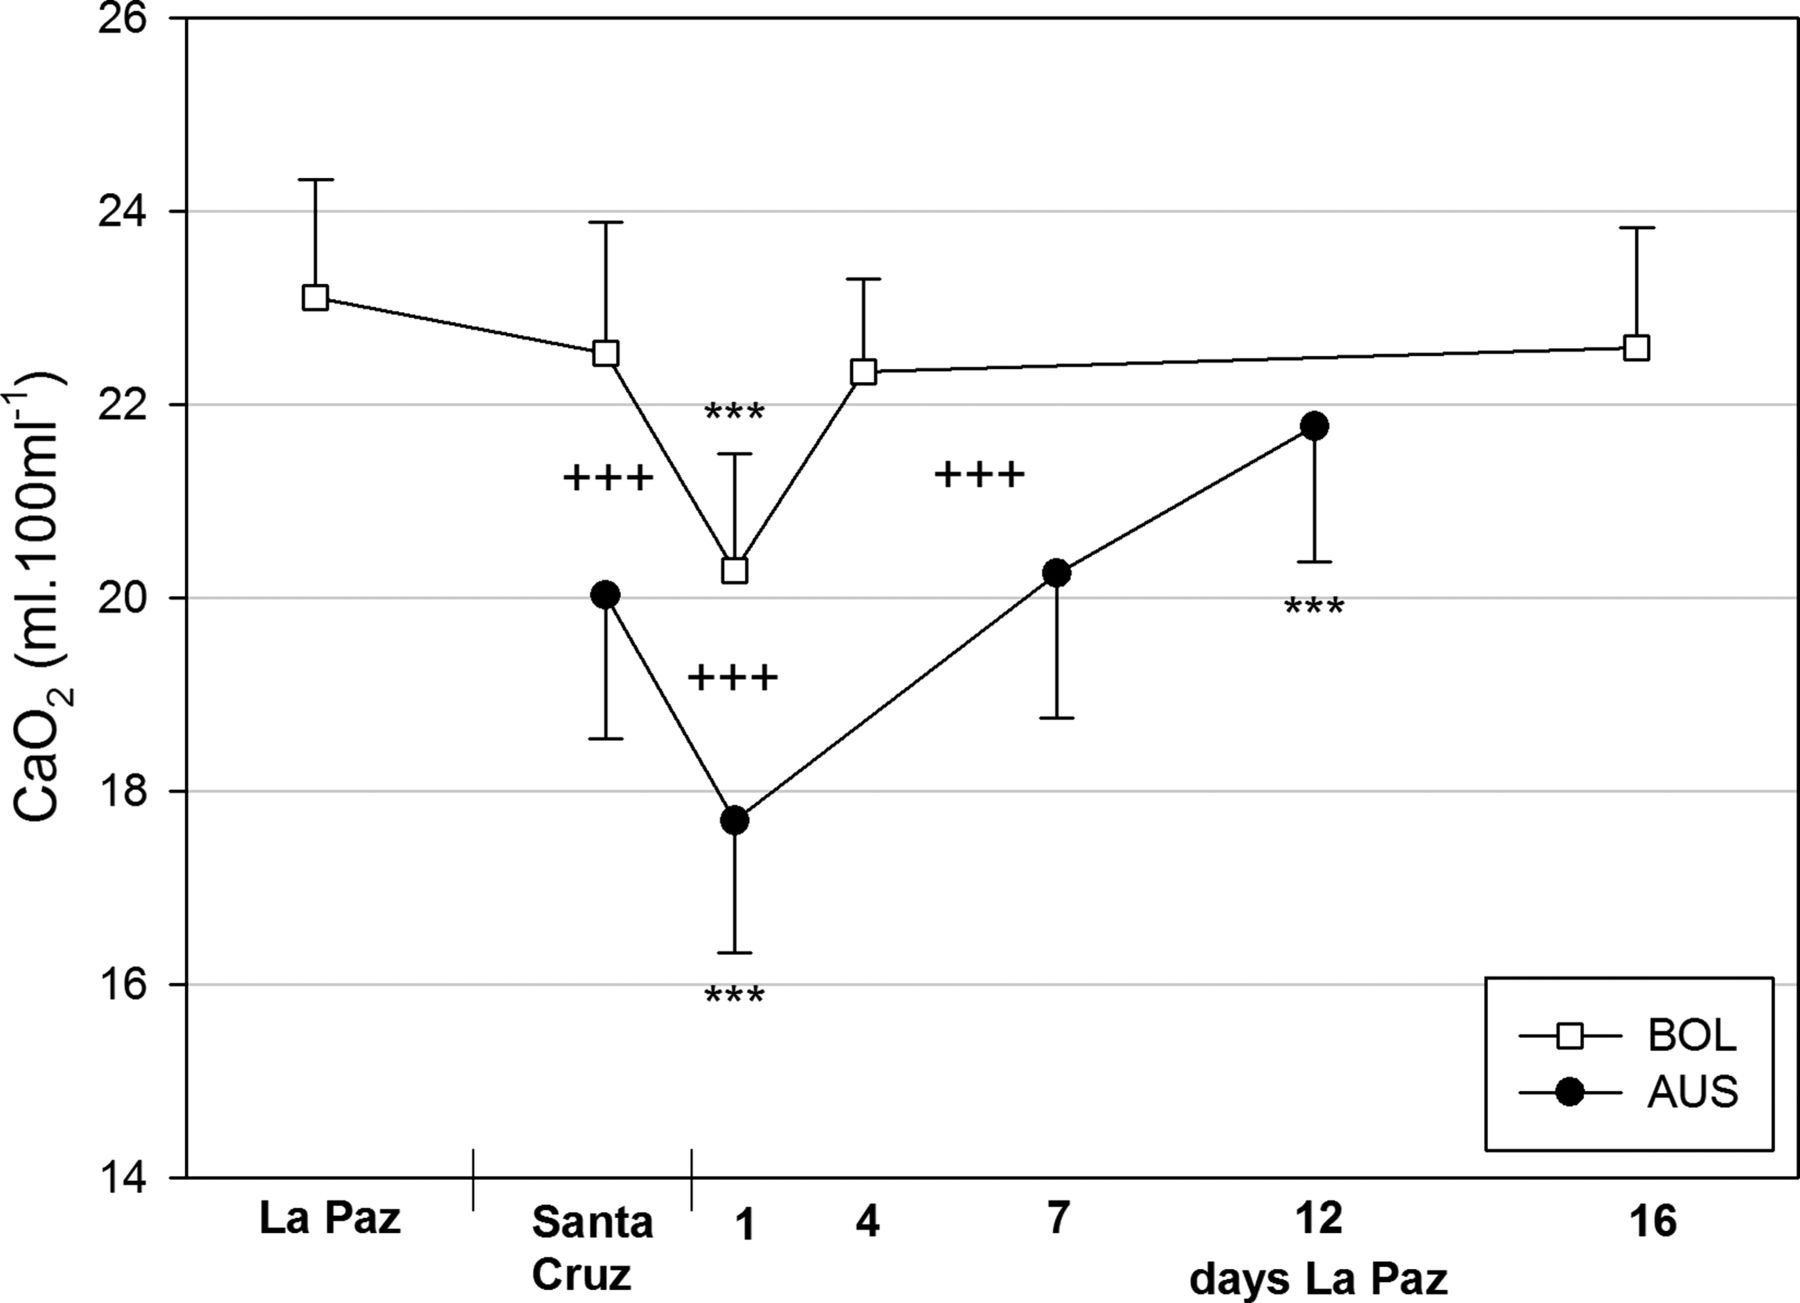
Oxygen content in arterialised blood (CaO2). For statistical information see figure 1.
The results of an analysis of covariance demonstrate that in both teams, the increase in CaO2 during acclimatisation (Australians) or reacclimatisation (Bolivians) to high altitude is mostly due to the decrease in BV followed by an increase in Hb-sO2, and for Australians, only partially to the increase in Hbmass (table 2).
Influence of haemoglobin oxygen saturation (Hb-sO2), haemoglobin mass (Hbmass) and blood volume on arterial oxygen content (CaO2)
Results of Yo-YoIR1 are presented in a companion paper.11 Briefly, total distance covered in the Yo-YoIR1 decreased in both teams at altitude compared to near sea-level, but to a greater extent in Australians. After 10 days, distance was restored to near sea-level values in the Bolivians but not Australians. Linear regression analysis showed a significant positive relationship between CaO2 and Yo-YoIR1 distance (figure 5).

Relationship between total distance covered in the Yo-Yo intermittent recovery test level 1 (Yo-YoIR1) performed at altitude (see our accompanying paper11) and CaO2. Yo-YoIR1 data are obtained from day 3 and day 10 at altitude. Hbmass data are obtained from preascent values and after 12 days of acclimatisation. AUS, Australian players; BOL, Bolivian players.
Discussion
This is the first study, to our knowledge, to examine the time course of BV and ventilatory responses to altitude in soccer players. The main finding was that ventilatory responses were delayed for a few hours upon ascent, with CaO2 consequently compromised in the short-term. Over time, CaO2 was compensated by increased hypoxic ventilation, a decrease in BV and, in Australians only, an increase in Hbmass.
BV, [Hb] and Hbmass
At baseline, the Bolivians were characterised by a higher Hbmass and [Hb] but smaller BV than Australians; the first of which demonstrates long-term adaptation to life-long living at altitude.7 ,17 ,18 Following descent, absolute values of Hbmass were held constant in the Bolivians, with no evidence of neocytolysis observed after 5 days. Neocytolysis describes the selective destruction of neocytes deemed to be in excess following a change in environment,19 ,20 for example, following altitude exposure.21 Our observations are similar to those in Kenyan altitude natives training at sea-level, where a decrease in Hbmass was not observed until a number of weeks at sea-level,22 indicating that in altitude natives living at 3600 m or lower, any decrease in Hbmass is a result of slowly altered red cell turnover as opposed to rapid neocytolysis.
The changes to BV and [Hb] observed in the Bolivians near sea-level were quickly restored to baseline levels after 5 days at 3600 m. Thus, it appears that even though altitude natives undergo several changes when they descend to low altitude, these adaptations are relatively labile and allow them to acclimatise quickly upon return to altitude, through changes in altitude diuresis. Although the acute time course of changes in BV during the first day of altitude could not be determined, we may assume them to be negligible. Previously, we have demonstrated that PV and extracellular water remained unchanged in the first day after ascent to 3600 m but considerably decreased the following days, due to hormonally provoked diuresis.23 Similarly, Loeppky et al24 report an unchanged PV within 10 h exposure to reduced barometric pressure of 432 mm Hg (corresponding to an altitude of ∼4300 m). The magnitude of decrease in BV of Australians and Bolivians determined over the subsequent days is consistent with data from others7 and can be explained mostly by the action of the diuresis-regulating hormones aldosterone, atrial natriuretic peptide and antidiuretic hormone.25 However, the influence of changes in temperature26 associated with changing altitude and exercise load27 on PV should also be considered. Since both teams did not considerably change their training habits from the prephase of the study (Santa Cruz) to the time period in La Paz, an influence of physical activity on PV is unlikely. On the other hand, since the day-temperature in La Paz is lower than in Santa Cruz, a thermal influence cannot be completely discounted as is demonstrated by seasonal variation in PV of up to 5%.28 However, since both teams spent the majority of time in Santa Cruz in air-conditioned rooms, we also expect such thermal influence to be minimal.
Conversely, Hbmass of Bolivians was stable at altitude, suggesting that the erythropoietic cascade was not accelerated despite the 6-day sojourn near sea-level, (although without [EPO] and reticulocyte data this assertion cannot be confirmed). Our observations appear to be in contrast to the ‘finely controlled erythropoietin regulation’ consistently observed in Chilean soldiers during long-term intermittent hypoxic exposure showing increased [EPO] when returning to altitude.7 Unfortunately, [EPO] data are unavailable at present, therefore we are unable to draw conclusions on possible differences in epidemiological adaptations over generations17 as opposed to during a single lifetime.
An increase in Hbmass was evident in the Australians after 7 days with a further increase measured on day 12. Mean data previously suggests an increase of 1% per 100 h of exposure at 3000 m,5 ,29 predicting a 3% change after 12 days—exactly the value observed. The expanded Hbmass was maintained 2 weeks after exposure in the Australian players who were measured, that is neocytolysis was not observed after their return to sea-level.
Blood gases and acid–base status
Immediately upon ascent, the challenge of oxygen availability is evident from the changes in blood gases. PaO2 and consequently Hb-sO2 were dramatically decreased in both teams, with the drop more evident in Australians who lacked any altitude acclimatisation, while Bolivians almost reached altitude baseline values within 5 days of reacclimatisation. PaCO2 was used inversely as a surrogate for ventilatory drive30; decreasing markedly in the first few days at altitude as ventilation increased. However, in the first few hours following arrival, the ventilatory drive of both teams remained low, with PaCO2 unchanged after 2 h at altitude. PaCO2 did not reach a plateau until the second week at altitude, consistent with previous reports that ventilation stabilises after 6 days at 4300 m.31
An important long-term adaptation to the altitude environment was evident in the Bolivians in the form of more effective pulmonary diffusion reflected by the higher PaO2 and Hb-sO2 at similar PaCO2 (figure 2). This finding concurs with previous data showing exceptionally high lung diffusion capacities in high-altitude natives.32 The absence of any pH changes immediately after ascent to altitude was due to the delayed hyperventilation,33 whereas the moderate increase in pH in the following days can be attributed to hyperventilation and not complete renal compensation, which is reflected by the lowered [HCO3−] and BE.
Arterial O2-content (CaO2)
CaO2 in the Bolivians did not change after 5 days near sea-level, despite a 7% increase in Hb-sO2. This hyperventilation effect was counterbalanced by ∼10% increase in BV, resulting in an equivalent drop in [Hb]. After ascent, the immediate fall in Hb-sO2 decreased CaO2 by ∼12% and 10% in Australians and Bolivians, respectively; but was completely compensated within 1 week; the most effective mechanism being the lowered PV, followed by ventilatory adaptations (table 2). The increased Hbmass accounts for only 20% of the CaO2 increase after 12 days and can be considered to be of minor importance for the Australians. However, if a longer acclimatisation period was adopted, and evoked similar Hbmass values to the Bolivians, the contribution of Hbmass to the CaO2 compensation would exceed 50%.
At moderate altitude, the decrease in CaO2 completely explains the reduction in aerobic power, whereas at high altitude (5300 m), the low CaO2 accounts for approximately two thirds of this loss,34 emphasising the importance of CaO2 for endurance performance. Indeed, this notion is supported by the relationship between CaO2 and Yo-YoIR1 distance at altitude as well as the less pronounced decrease in Yo-YoIR1 distance 3 days after arrival at 3600 m in the Bolivians compared to the Australians (when CaO2 was almost fully compensated), and which subsequently increased to near sea-level values restored by day 10.11 Thus, short-term reacclimatisation was likely sufficient to restore aerobic power of the Bolivians in their normal environment, whereas for sea-level natives, it is apparent that an optimal acclimatisation requires more time.
Anecdotal reports have led to a common belief that a ‘fly-in, fly-out’ approach, with games played within hours of arrival, minimises performance impairment. The almost unchanged acid–base status within 2 h of arrival indicates a preserved buffer capacity, and may partially support this notion. However, this belief is contradicted by the low PaO2 and CaO2 at the same time point. In addition, global positioning system (GPS) analysis of the activity profile of the players during matches indicates an altitude-induced reduction in match running which is not attenuated by playing immediately upon arrival.10
Limitations
A major limitation of the study is that only physiological data obtained under resting conditions are available. Inferences regarding changes in blood gases and saturation during exercise can only be made based on data currently available in the literature.4 Further, it is possible that some responses were compromised in the case of the Australians as a result of mild illness.
Conclusion
Soccer matches at altitude are presently unavoidable. Our data indicate that CaO2 is a major limiting factor for sea-level natives at altitude. The ventilatory response appears to be delayed for several hours after arrival, thereby maintaining a stable acid–base status and buffer capacity, but is unlikely to compensate for the dramatic decrease in PaO2 and CaO2 immediately after ascent. CaO2 is fortunately compensated following a period of acclimatisation. While adaptive differences between native sea-level and altitude residents were still evident after 12 days of acclimatisation, aerobic power was partially recovered, indicating 2 weeks of altitude acclimatisation may be a reasonable compromise for sea-level teams required to play at altitude. However, the logistics and time constraints associated with this strategy remain a challenge.
What are the new findings?
-
Arterial oxygen content (CaO2) is a major limiting factor for sea-level natives at altitude.
-
The ventilatory response appears to be delayed for several hours after arrival, thereby maintaining a stable acid–base status and buffer capacity, but is unlikely to compensate for the dramatic decrease in arterial partial pressure for oxygen and CaO2 immediately after ascent.
-
Adaptive differences between native sea-level and altitude residents were still evident after 12 days of acclimatisation, but endurance performance was substantially recovered.
How might the findings impact clinical practice in the near future:
-
Changes in arterial oxygen availability (CaO2) following ascent do not appear to support a ‘fly-in, fly-out’ approach for playing at altitude, although other physiological data should also be considered.
-
Two weeks of altitude acclimatisation may be a reasonable compromise for teams required to play at altitude.
Acknowledgments
The authors would like to thank the players and staff of both teams as well as Radiometer, Germany for their technical assistance.
References
Footnotes
-
Collaborators Martin Buchheit; Ben M Simpson.
-
Contributors NW, MK and WFS were involved in acquisition of data, analysis and interpretation of data, drafting the article and approval of the final version. HS was involved in conception and design, critically revising the article for important intellectual content and approved the final version. RJA and CJG were involved in conception and design, analysis and interpretation of data, critically revising article for important intellectual content and approval of the final version. PCB was involved in conception and design, acquisition of data, analysis and interpretation of data, critically revising article for important intellectual content and approval of the final version. KH, GDR and JCJC were involved in acquisition of data, critically revising article for important intellectual content and approval of the final version. CS was involved in acquisition of data, critically revising article for important intellectual content. RS was involved in conception and design, acquisition of data, critically revising article for important intellectual content and approval of the final version. LAG-L was involved in conception and design, acquisition, analysis and interpretation of data, drafting the article and approval of the final version.
-
Competing interests None.
-
Ethics approval Australian Institute of Sort Human Ethics Committee.
-
Provenance and peer review Not commissioned; externally peer reviewed.