Article Text

Abstract
Objectives To systematically review and analyse studies of high amounts of physical activity and mortality risk in the general population.
Eligibility criteria Inclusion criteria related to follow-up (minimum 2 years), outcome (mortality from all causes, cancer, cardiovascular disease (CVD) or coronary heart disease), exposure (eg, a category of >1000 metabolic equivalent of task (MET) min/week), study design (prospective cohort, nested case control or case-cohort) and reports of cases and person years of exposure categories.
Information sources Systematic searches were conducted in Embase and Pubmed from database inception to 2 March 2019.
Risk of bias The quality of the studies was assessed with the Newcastle–Ottawa scale.
Included studies From 31 368 studies identified, 48 were included. Two authors independently extracted outcome estimates and assessed study quality.
Synthesis of results We estimated hazard ratios (HRs) using random effect restricted cubic spline dose–response meta-analyses. Compared with the recommended level of physical activity (750 MET min/week), mortality risk was lower at physical activity levels exceeding the recommendations, at least until 5000 MET min/week for all cause mortality (HR=0.86, 95% CI 0.78 to 0.94) and for CVD mortality (HR=0.73, 95% CI 0.56 to 0.95).
Strengths and limitations of evidence The strengths of this study include the detailed dose–response analyses, inclusion of 48 studies and examination of sources of heterogeneity. The limitations include the observational nature of the included studies and the inaccurate estimations of amount of physical activity.
Interpretation Compared with the recommended level, mortality risk was lower at physical activity levels well above the recommended target range. Further, there was no threshold beyond which lifespan was compromised.
Registration PROSPERO CRD42017055727.
- physical activity
- meta-analysis
- cardiovascular
- death
Statistics from Altmetric.com
Introduction
High levels of physical activity are becoming increasingly widespread in the general population. For example, an estimated 1.9 million people finished a half-marathon in the USA in 2016, four times higher than in the year 2000.1 Cardiac arrests and sudden deaths occurring in the context of participation in running or other endurance races, such as triathlons, have often been reported.2 3 The public announcements of these events typically receive significant media attention and lead to immediate concerns of whether engagement in high levels of physical activity could be dangerous for long term health.
While engagement in physical activity at a level consistent with the current public health guidelines is known to have many health benefits,4 the evidence that higher levels of physical activity above the current target range is deleterious or beneficial for longevity is inconclusive. Several studies have proposed a U shaped or a reverse J shaped relationship between physical activity and mortality (ie, the mortality risk reduction is attenuated or eliminated at a high threshold of physical activity).5 6 Some authors have even advised that the daily amount of vigorous physical activity should not exceed 50 min.5
Previous observational studies comparing mortality risks among endurance athletes with those from the general population have reported greater longevity among athletes.7 8 However, such studies are generally unable to account for other determinants of health and disease which precludes unbiased comparison of different physical activity levels. Analyses of large scale prospective cohort studies are essential to further examine the shape of the dose–response relationship at higher volumes of activity; identify whether an upper limit of benefit exists; or if additional physical activity could be harmful to longevity.
We carried out a systematic review and meta-analysis of prospective cohort studies of physical activity and mortality to clarify if there is a greater all cause and cause specific mortality risk associated with high levels of physical activity above the recommended amounts. The primary outcomes were mortality from all causes and cardiovascular disease (CVD); secondary outcomes were mortality from cancer and coronary heart disease (CHD).
Methods
We registered the study protocol with PROSPERO (CRD42017055727) and followed the MOOSE reporting guidelines.
Search strategy and selection criteria
One author performed systematic literature searches in Embase and PubMed from database inception to 2 March 2019, combining search words for mortality, physical activity, humans and the eligible study designs. Details of the searches are available in the online supplementary appendix etable 1. Two authors independently decided which studies should be included in this review and potential disagreements were resolved through discussion, involving a third author when necessary. We included studies written in English or in a Scandinavian language (Danish, Norwegian or Swedish). The references of the included studies were also manually checked for relevant studies. We did not include abstracts or unpublished studies.
Supplemental material
Studies were eligible if they met all of the following criteria: (1) had a minimum follow-up period of 2 years; (2) the outcome was mortality from all cause, CVD, cancer or CHD; (3) had a prospective cohort, case cohort, or nested case control study design. To obtain categories of physical activity that would facilitate comparison of approximately the recommended level of physical activity with levels above those recommended, we furthermore required that: (i) the investigators reported the results of at least three physical activity categories, where the assigned physical activity (midpoint of the physical activity range, mean or median) for one category was between 450 and 1800 metabolic equivalent of task (MET) min/week and >1000 MET min/week for another category; (ii) these two categories could not include individuals not participating in physical activity, meaning that eligible studies had to either exclude these individuals or include them in a separate low physical activity category; (iii) studies did not exclusively examine work related physical activity or a specific risk group. In addition, information about number of participants/person years and number of cases for each physical activity category used in the analyses was mandatory for a study to be included. We asked authors to provide this information if it was not reported.
Data analysis
One author extracted hazard ratios (HR) from the studies while another author checked these outcome estimates. The HRs that were most appropriately adjusted were extracted. We considered appropriate adjustments as adjustments for alcohol, smoking, diet, history of cancer and CVD, race/ethnicity, socioeconomic aspects, age and sex.
One author extracted other data from the studies: first author’s surname, publication year, study location, study period, study design, sex, number of participants, number of deaths and person years of follow-up, mortality outcome, physical activity categories, physical activity intensity, physical activity measurement method and covariates adjusted for in the analyses.
The median or mean physical activity level within exposure categories was assigned to the corresponding HR. If these were not reported, we used the midpoint between the lower and upper boundary of the exposure category. If these were not reported, we generally assumed the interval in the highest category to be equivalent to the interval in the next highest exposure category. We used MET values from the Compendium of Physical Activities to calculate MET min.9 Generally, a value of 3 MET was used for walking, 4.5 MET for moderate physical activity, 5 MET for moderate to vigorous physical activity and 8 MET for vigorous physical activity/sports/running. To convert kcal to MET min, we assumed that men weighed 80 kg and that women weighed 60 kg. The original exposure categories and our calculation of MET min are presented in the online supplementary appendix eTable 2 for studies that did not report MET min or MET hours of their exposure categories.
Two authors used a modified version of the Newcastle–Ottawa quality assessment scale for quality assessment of prospective cohort studies.10 Informed by methodological considerations specific to our research question, we predefined the following for each item: 'selection of the non-exposed cohort', a star was given if physically active and inactive participants were selected from the same source population; 'ascertainment of exposure', a star was given if a validated physical activity questionnaire, an objective assessment of physical activity or a trained interviewer were used to assess physical activity; 'demonstration that the outcome of interest was not present at the start of the study', a star was given if exclusion/adjustment of participants with baseline CVD (both stroke or CHD) and cancer in analyses of all cause mortality, of participants with baseline CVD in analyses of CVD or CHD mortality and of participants with cancer in analyses of cancer mortality (or report of sensitivity analyses showing that the estimates were not materially affected by baseline CVD or cancer); 'comparability of cohorts on the basis of the design or analysis', a star was given if estimates were adjusted (by statistical adjustment or restriction) for age, sex, smoking and alcohol, and they were given two stars if estimates additionally were adjusted (by statistical adjustment or restriction) for diet, family history of cancer and CVD, race and socioeconomics; 'assessment of outcome', a star was given if they ascertained the outcome by registers or death certificates (or next of kin only for all cause mortality); 'was follow-up long enough for outcomes to occur', a star was given if the period of follow-up was a minimum of a mean/median of 5 years; 'adequacy of follow-up of cohorts', a star was given if death during follow-up was register based or report of a minimum of 90% follow-up of participants when other methods were applied. We chose not to include the 'representativeness of the exposed cohort' item of the original Newcastle–Ottawa scale as the purpose of our quality assessment was to evaluate internal validity and not external validity. Thus a total of 8 stars were achievable.
Statistical analyses were performed using the glst command in Stata 13 & 14.11 Random effects meta-analyses using the methods of moments procedure were used to pool HRs. A restricted cubic spline dose–response meta-analysis was performed, taking into account the correlation within each set of HRs.12 Knot location in the restricted cubic spline regression were the 10th, 50th, and 90th percentiles of the overall exposure distribution.13 Non-linearity was assessed by testing if the coefficient of the second spline transformation was equal to zero. Post-estimations based on the dose–response model were conducted to predict HRs of specific numbers of MET min (0, 500, 1000, 2000, 3000, 4000, 5000 and 6000). We chose 750 MET min/week as the reference for the dose–response analyses as this is the midpoint of the recommended physical activity of 500–1000 MET min/week.4
We estimated absolute rate differences (ARD) based on an estimated unadjusted mortality rate during a median of 10.5, 13.3, 10.6 and 13.3 years of follow-up for mortality from all causes, CVD, cancer and CHD for the reference category (750 MET min/week) pooled across studies with available data, and based on the adjusted HRs that were post estimated from the non-linear dose–response analysis.14
Heterogeneity between studies was examined using the I2 statistic15 with values of 25%, 50% and 75% corresponding to low, moderate and high level of heterogeneity, respectively. Meta-regression and stratified analyses were conducted to investigate heterogeneity of estimates across age, sex, exclusion of participants with baseline CVD/cancer, physical activity intensity and physical activity restricted to leisure time (post hoc), follow-up time (post hoc), nationality (post hoc), use of accelerometers or not (post hoc), MET min reported in original study or not (post hoc), validity of physical activity ascertainment (post hoc), quality score and confounder adjustment corresponding to our quality assessment. Due to insufficient data, some subgroup analyses were not performed for all outcomes.
To examine goodness of fit of the dose–response models, the R2 coefficient was used to evaluate the degree of agreement between model prediction and empirical data, and the decorrelated residuals versus exposure plot was visually inspected to see if the fit depended on the exposure level (post hoc).16 Furthermore, the effect on the dose–response relation of excluding one study at a time was examined (post hoc). Publication bias was assessed by visually inspecting funnel plots of the HR (estimated with physical activity as a linear predictor) against the SE of each study and by Egger’s regression test of funnel plot asymmetry.17 All tests were two sided and 0.05 was chosen as the significance threshold.
Patient and public involvement
This research was done without patient involvement. Patients were not invited to comment on the study design and were not consulted to develop patient relevant outcomes or interpret the results. Patients were not invited to contribute to the writing or editing of this document for readability or accuracy.
Results
From 31 368 studies (excluding 3769 duplicate studies) identified through systematic literature searches, we included 48 prospective cohort studies.18–62 One of these studies comprised six individual cohorts18 and another nine individual cohorts.45 We did not find any relevant studies based on the other eligible study designs. A PRISMA flow chart is shown in figure 1.63

Flowchart of the literature search and literature inclusion.
Details of the included studies can be found in the online supplementary appendix etable 3. Five studies used accelerometers to measure physical activity21 25 35 38 43 while all other studies used self-reported physical activity. All five studies using accelerometers had all cause mortality as an outcome while two of these studies also had mortality from CVD and cancer as outcomes.25 38 Eight of the physical activity measures, for which we extracted risk estimates, potentially included some occupational physical activity.21 24 25 30 35 38 43 60 Most studies focused on moderate to vigorous physical activity or physical activities in leisure time (see online supplementary appendix etable 3), and some studies specifically included household physical activity in their physical activity measure.19 30 32 33
Using the Newcastle–Ottawa scale, 1 study was assigned the maximum of 8 stars in the quality assessment, 12 studies were assigned 7 stars, 20 studies were assigned 6 stars, 8 studies were assigned 5 stars, and 2 studies were assigned 4 stars (see online supplementary appendix etable 4). Some studies were assigned a number of stars for one outcome and another number of stars for another outcome: 2 studies were assigned 5–6 stars and 1 study was assigned 6–7 stars. No studies were assigned 3 or fewer stars.
All cause mortality
We found a curvilinear inverse relationship between physical activity and all cause mortality (P non-linearity <0.001) (figure 2, table 1). With 750 MET min as the reference level, the lowest HR (HR=0.82, 95% CI 0.81 to 0.84) and the highest ARD (ARD=−16 deaths per 10 000 person years, 95% CI −17 to −14) were reached at around 2000 MET min, while the HR at 6000 MET min was 0.88 (95% CI 0.78 to 0.99) and the ARD was −11 deaths per 10 000 person years (95% CI −19 to −1), compared with the recommended level. Although the shape of the curve above 2000 MET min/week was slightly sensitive to the choice between estimating with the method of moments procedure versus estimating with the restricted maximum likelihood procedure, the results were not materially affected (see online supplementary appendix, efigure 3).
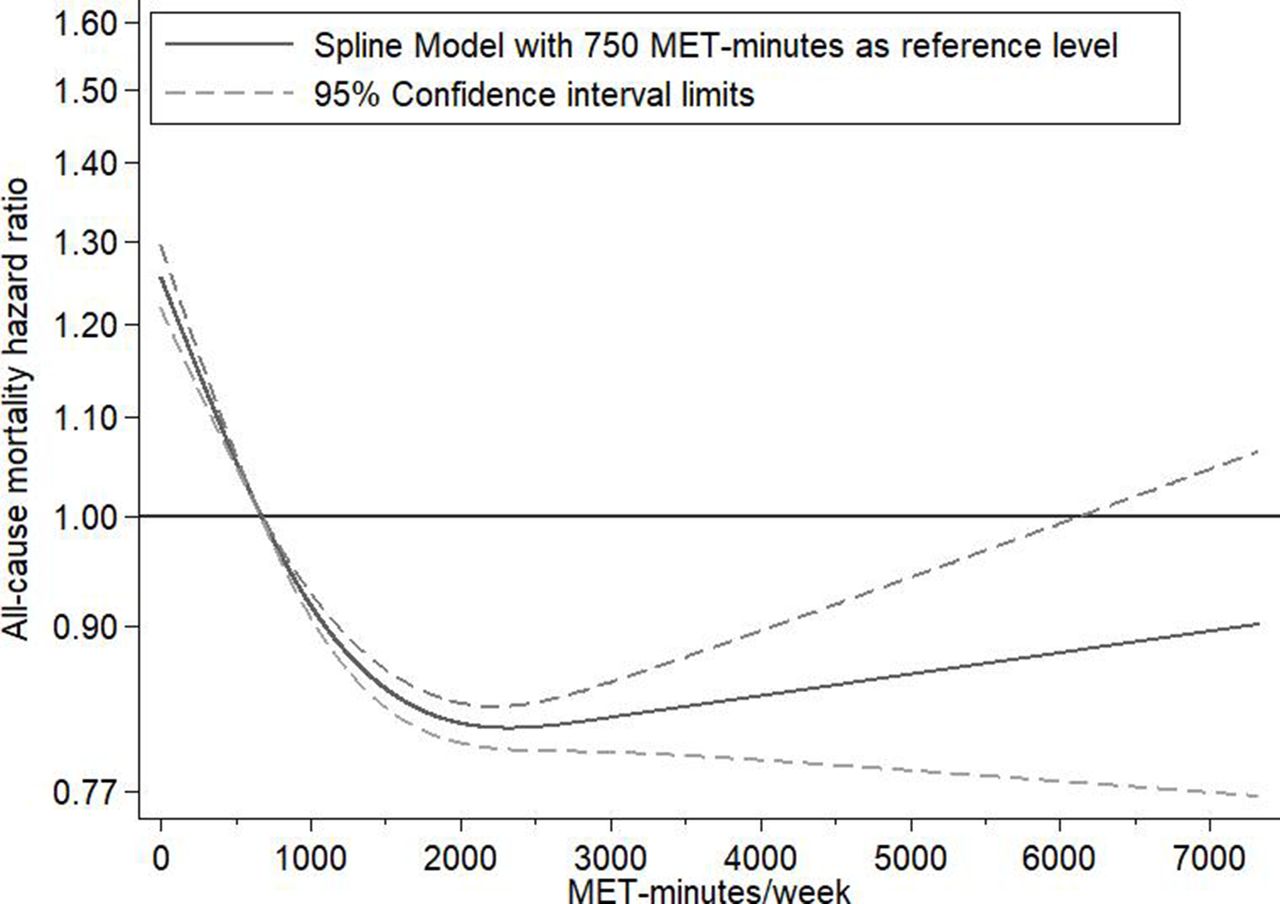
Dose–response relationship between physical activity and all cause mortality. Dose–response relation between metabolic equivalent of task (MET) min/week (with 750 MET min/week as the reference) and mortality risk estimated with restricted cubic spline regression and generalised least square trend estimation for summarised dose–response data.
Mortality HRs with 750 metabolic equivalent of task (MET) min/week as reference and estimated absolute rate differences per 10 000 person years
There was a high between study variance (I2=77%–80%, 95% CI 70% to 85%) in this analysis. The funnel plot was asymmetric, and we found a P value of 0.005 with Egger’s test (see online supplementary appendix eFigure1). We found significant interactions between physical activity and physical activity measurement method and adjustment/no adjustment for baseline disease, respectively, on all cause mortality HR (see online supplementary appendix etable 5). Above 2000 MET min, the HRs were lower for studies adjusting for baseline disease compared with studies not adjusting for baseline disease, and we found larger HR differences in studies with accelerometer measured physical activity compared with studies with self-reported physical activity (see online supplementary appendix etable 5). In analyses of studies with accelerometer measured physical activity, the HR was 2.03 (95% CI 1.62 to 2.54) at 0 MET min and 0.47 (95% CI 0.34 to 0.65) at 3000 MET min. The HR differences also appeared larger in studies of participants of at least 60 years of age compared with studies including younger participants. In the subgroup analysis of high quality studies (7–8 stars), the HR at 5000 MET min was 1.04 (95% CI 0.77 to 1.39).
CVD mortality
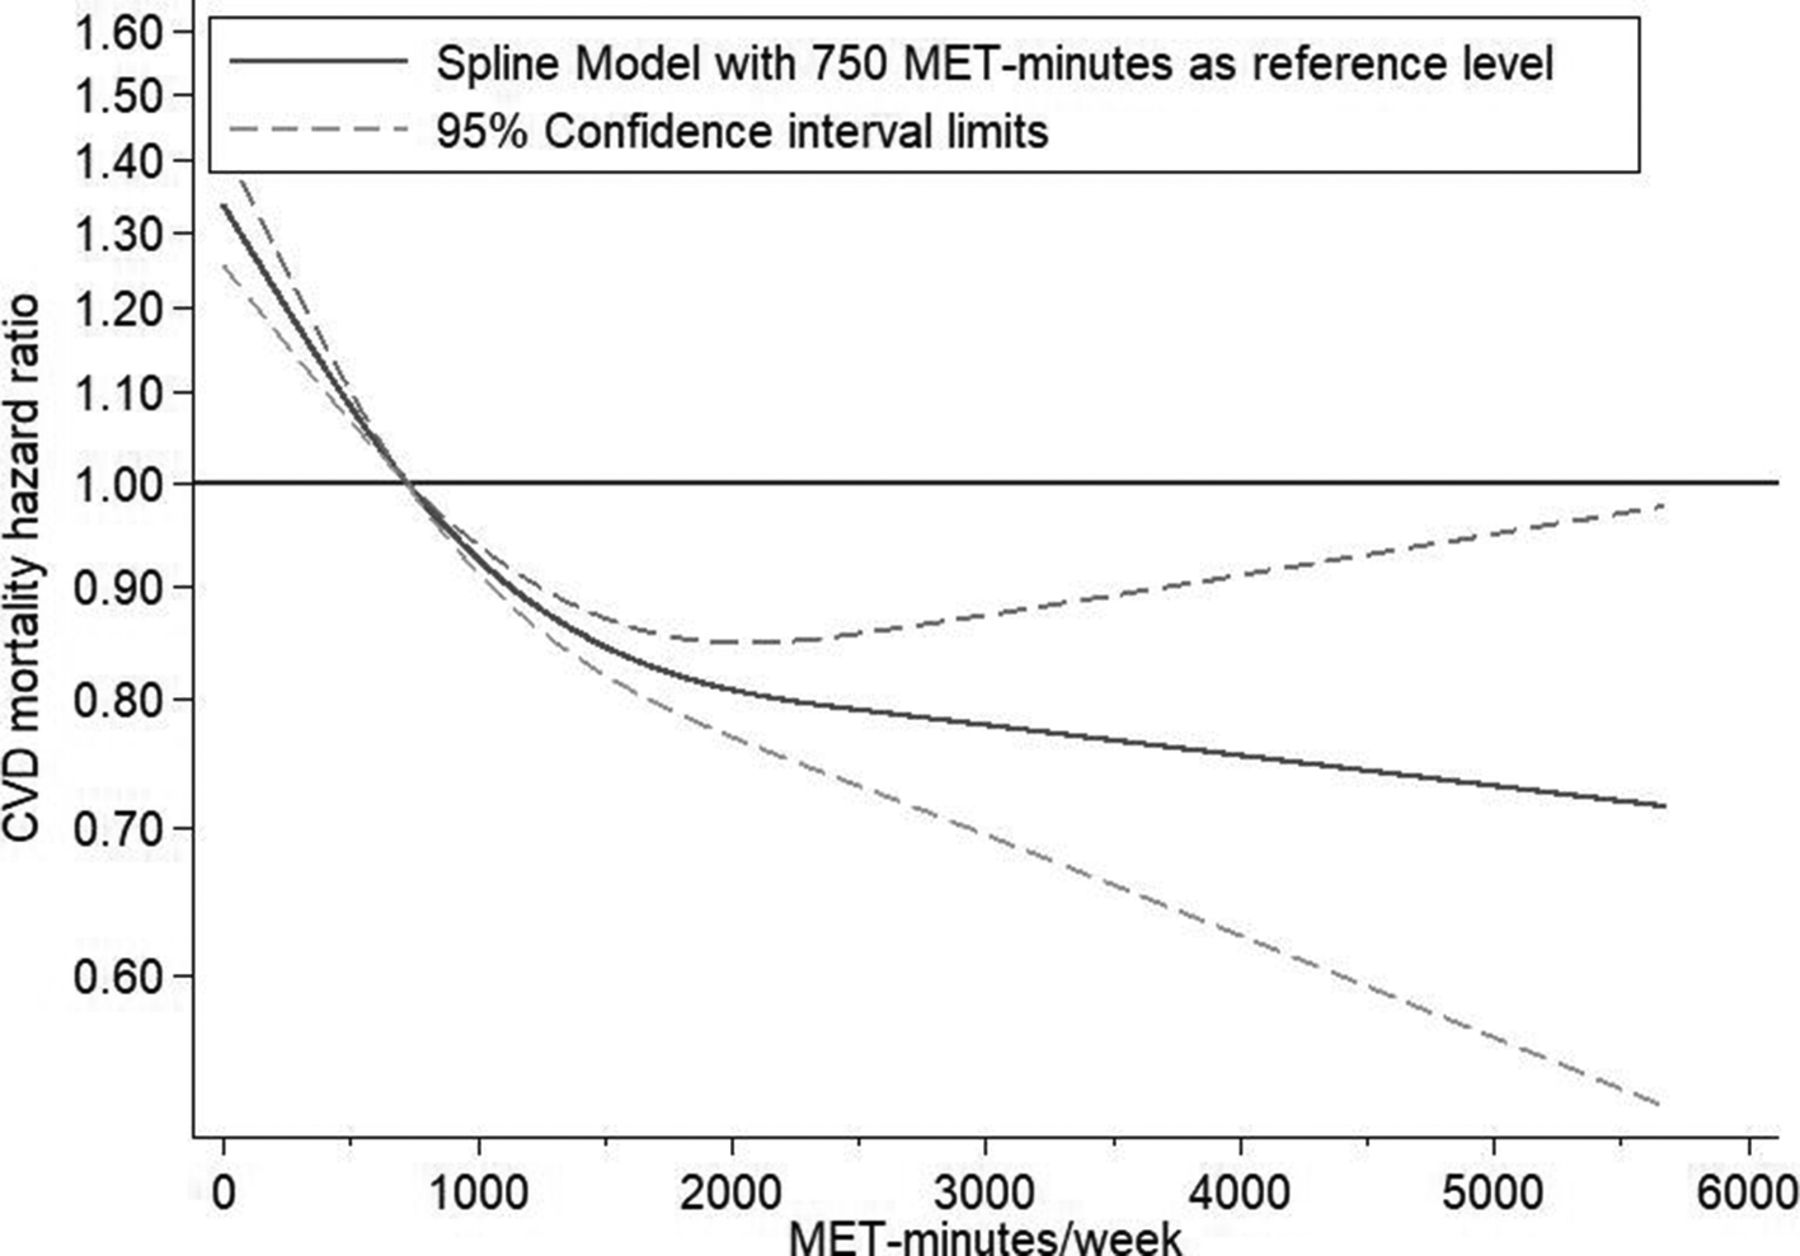
We found an inverse relationship between physical activity and CVD mortality (P non-linearity <0.001) (figure 3, table 1). The mortality risk was lower for all physical activity levels above the recommended level compared with the recommended level. With 750 MET min as the reference level, the HR at 2000 MET min was 0.81 (95% CI 0.77 to 0.85) and the ARD was −5 deaths per 10 000 person years (95% CI −6 to −4), while the HR at 5000 MET min was 0.73 (95% CI 0.56 to 0.95) and the ARD was −7 deaths per 10 000 person years (95% CI −11 to −1). There was a medium between study variance (I2=68–74%, 95% CI 51% to 82%) in this analysis. The funnel plot and Egger’s test could not rule out publication bias (P=0.133) (see online supplementary appendix efigure 2). We found statistically significant multiplicative interactions between physical activity and physical activity measurement method on CVD mortality HRs. We found larger HR differences in studies using accelerometers compared with studies not using accelerometers (see online supplementary appendix etable 6). The HR differences also appeared larger in studies of participants of at least 60 years of age compared with studies including younger participants. In the subgroup analysis of high quality studies (7–8 stars), the HR at 5000 MET min was 0.89 (95% CI 0.59 to 1.34).

Dose–response relationship between physical activity and cardiovascular disease (CVD) mortality. Dose–response relation between metabolic equivalent of task (MET) min/week (with 750 MET min/week as the reference) and mortality risk estimated with restricted cubic spline regression and generalised least square trend estimation for summarised dose–response data.
Cancer mortality
We found a curvilinear inverse relationship between physical activity and cancer mortality (P non-linearity <0.001) (see online supplementary appendix etable 2, efigure 4). With 750 MET min as the reference level, the lowest mortality risk (HR=0.89, 95% CI 0.86 to 0.92 and ARD= −3 deaths per 10 000 person years, 95% CI −4 to −2) was reached at around 2000 MET min, while the HR at 5000 MET min was 0.93 (95% CI 0. 0.79 to 1.09) and the ARD was −2 deaths per 10 000 person years (95% CI −6 to 2). There was a low between study variance (I2=7–22%, 95% CI 0% to 55%) in this analysis. We found a P value of 0.543 with Egger’s test and the funnel plot was symmetric (see online supplementary appendix efigure 5). We found significant multiplicative interactions between physical activity and adjustment/no adjustment for baseline disease and sufficient or insufficient adjustment for confounding, respectively, on cancer mortality HRs. Above 2000 MET min, the HRs were lower for studies adjusting baseline disease compared with studies not adjusting for baseline disease (see online supplementary appendix etable 7). In the subgroup analysis of high quality studies (7–8 stars), the HR at 5000 MET min was 0.87 (95% CI 0.61 to 1.24).
CHD mortality
We found an inverse relationship between physical activity and CHD mortality (P non-linearity=0.04) (see online supplementary appendix etable 2 and efigure 6). With 750 MET min as the reference level, the HR at 2000 MET min was 0.79 (95% CI 0.74 to 0.85) and the ARD was −3 deaths per 10 000 person years (95% CI −4 to −2), while the HR at 5000 MET min was 0.65 (95% CI 0.44 to 0.95) and the ARD was −6 deaths per 10 000 person years (95% CI −9 to −1). There was a medium between study variance (I2=46–59%, 95% CI 0% to 72%) in this analysis. The funnel plot was asymmetric, and we found a P value of 0.005 with Egger’s test (see online supplementary appendix efigure 7). We detected no statistically significant multiplicative interactions. Yet, above 1000 MET min/week, the HRs appeared lower in studies with less than 15 years of follow-up than in studies with a longer follow-up (see online supplementary appendix etable 8). In the subgroup analysis of high quality studies (7–8 stars), the HR at 5000 MET minutes was 0.42 (95% CI 0.18 to 0.97).
All outcomes
Omitting one study at a time only slightly affected the overall shape of the dose–response relationships except for the cancer curve that was considerably affected by leaving out either one of two large studies (see online supplementary appendix eFigures 6–9 (post hoc)). The curves based on the analyses including these two studies had a positive slope from 2000 to 5000 MET min/week, whereas the curves based on the analyses omitting one of these two studies did not.18 45
The decorrelated residuals versus exposure plots showed a less adequate fit at MET min/week >4000 for the cancer mortality model (see online supplementary appendix efigure 10–13 (post hoc)). Placing the top knot at a higher percentile led to lower R2 coefficients for all cause mortality and for cause specific mortality (see online supplementary appendix etable 9 (post hoc)).
Discussion
This meta-analysis compared the recommended (by public health authorities) level of physical activity with higher levels of physical activity. Our findings do not provide evidence for increased mortality risk with physical activity amounts as high as seven times above the current recommended target range. All cause, CVD and CHD mortality risks were lower at physical activity levels up to approximately 5–7 times the recommended level but the additional reduction in risk of mortality with engagement in activity at levels beyond the recommendations was modest and with increasing uncertainty, as reflected by the wide confidence intervals. Thus based on all of the available studies, we did not identify a higher mortality risk at any level of physical activity above the recommended level, although the lowest point estimate for all cause mortality was approximately 2000 MET min. Our analyses suggest that 10–12 hours of weekly vigorous physical activity cannot be considered harmful to longevity.
A previous systematic review of all cause mortality and a systematic review of CVD mortality found continuously lower mortality HRs with increasing amounts of physical activity until the highest amount in their analyses: 300 min and 4800 MET min of weekly physical activity, respectively.64 65 In another meta-analysis, the lower risk of breast cancer, colon cancer, diabetes, ischaemic heart disease and ischaemic stroke associated with total activity was not attenuated in individuals participating in 8000 or more MET min/week of total physical activity.66 A narrative review concluded that it remains uncertain whether vigorous, long term endurance training may cause adverse health effects.67 The present study addresses an important gap in the literature by finding that up to 6000 MET min/week was not associated with a higher mortality risk compared with the recommended level of physical activity. Furthermore, previous systematic reviews have not investigated the impact of the method of measuring physical activity. We found notably larger effect sizes in the studies that measured physical activity with accelerometers compared with the studies that measured physical activity by self-report. However, these findings could reflect other study differences, for example, the studies with accelerometer measured physical activity had shorter follow-up times than the studies with self-reported physical activity, which could make them more prone to reverse causation.
The strengths of the present study include the detailed dose–response analysis to illustrate the relationship between physical activity and mortality by non-linear modelling, the inclusion of 48 studies and thorough examination of sources of heterogeneity. The HR estimates were mostly homogenous across subgroups with some exceptions in relation to age, physical activity measurement method, follow-up time and adjustments. In addition, most analyses were robust to the influence of exclusion of any single study.
This study has several limitations. First, the original studies of this meta-analysis are observational and thus limited by residual and unknown confounding, information and selection bias, and reverse causation. Attempts to limit reverse causation in sensitivity analyses by only including studies with exclusion of individuals with baseline cancer and CVD did, however, show results that were consistent with the overall study results. Second, the calculation of MET min may lack precision, especially when the original intervals for the physical activity categories are wide and without reports of median or mean. Furthermore, the ability of questionnaires and accelerometers to capture physical activity differs, and the relationship between physical activity and mortality was weaker in questionnaire based studies than in accelerometer based studies, possibly due to dilution bias when relying on imprecise physical activity self-reports.68 Third, the Newcastle–Ottawa scale used for the quality assessment lacks a detailed manual for implementation among other limitations.69–71 Thus the stratified analyses based on the Newcastle–Ottawa scale score should be interpreted with caution. However, the Cochrane handbook refers to the Newcastle–Ottawa scale as a useful tool,72 and the quality of the included studies could have affected the risk estimates. Fourth, the between study variance was high for all cause mortality and medium for CVD mortality, and examination of heterogeneity by subgroup analyses is prone to confounding by other study characteristics. Fifth, publication bias could have inflated the mortality HRs, as indicated by the asymmetric funnel plots. However, publication bias is only one possible explanation for an asymmetric funnel plot, which due to the large heterogeneity in all cause mortality analyses should be interpreted with caution.73 74 Sixth, the relationship between leisure time physical activity and mortality likely depends on the amount of sitting and on the amount of physical activity done at the workplace and in the home, which was not possible to examine in the present meta-analysis. Seventh, the analyses depend on the chosen models, and the decorrelated residuals versus exposure plot for cancer mortality indicated a less adequate fit at high levels of physical activity. Eighth, assuming linearity beyond the final knot, which was around 2600–3000 MET min/week in main analyses, limits the ability to detect a shift in the dose–response relationship beyond this point. Ninth, avoiding language restrictions in the literature search and including additional databases may have provided additional relevant studies.
In this meta-analysis we did not find a limit of physical activity level beyond which mortality risk increases compared with the recommended range. On the contrary, mortality risk was lower at physical activity levels well above the current recommended target. We observed no excess mortality risk among individuals engaging in a volume of activity corresponding to more than 10 of weekly vigorous activity. The evidence we reviewed does not support recommendations for highly active individuals to reduce their physical activity level.
What is already known about this topic
Previous observational studies of high amounts of physical activity and risk of mortality have been inconclusive with contradictory conclusions.
It remains uncertain whether physical activity levels well beyond the recommended amount could be harmful.
What this study adds
Engagement in a weekly physical activity amount of 5000 MET min was not associated with an increased risk of mortality from all causes or cardiovascular diseases compared with the recommended target range of physical activity.
Higher physical activity level was associated with lower mortality risk compared with the recommend level of physical activity. We did not find a threshold of physical activity beyond which lifespan was compromised.
Acknowledgments
Ms Maibritt E Olsen, MSc,1 and Mr Martin T Ernst, MSc,2 for assisting with the literature search and literature screening. Dr Kieran McCaul, PhD,3 Professor Weihong Chen, PhD,4,5 Ms Ying Liu, MS, MPH,6 Professor Annlia Paganini-Hill, PhD,7 Professor I-Min Lee, ScD,8,9 Dr Carlos A Celis-Morales, PhD,10 for providing additional information on published studies. Only Martin T Ernst was compensated.
1Research Unit for Exercise Epidemiology, Department of Sports Science and Clinical Biomechanics, University of Southern Denmark, Odense, Denmark
2Clinical Pharmacology and Pharmacy, University of Southern Denmark, Odense, Denmark
3WA Centre for Health and Ageing, University of Western Australia, Australia
4Department of Occupational and Environmental Health, School of Public Health, Tongji Medical College, Huazhong University of Science and Technology, Wuhan, China
5Key Laboratory of Environment and Health in Ministry of Education and Ministry of Environmental Protection, and State Key Laboratory of Environmental Health, School of Public Health, Tongji Medical College, Huazhong University of Science and Technology, Wuhan, China
6Division of Epidemiology, Department of Medicine, Vanderbilt-Ingram Cancer Center, Vanderbilt Epidemiology Center, Vanderbilt University School of Medicine, Nashville, USA
7University of California Irvine School of Medicine, Department of Neurology, USA
8Brigham and Women’s Hospital, 900 Commonwealth Ave E, Boston, MA 02215, USA
9Harvard TH Chan School of Public Health, USA
10Institute of Cardiovascular and Medical Sciences, University of Glasgow, Glasgow G12 8TA, UK
References
Footnotes
Contributors KB and AG conceived and designed the study. KB and CFB selected the articles. KB, CFB and MR-L extracted the data. KB, CFB and AG assessed the quality of the included studies. KB and AC performed the data analysis. KB and AG wrote the first draft of the manuscript. KB, AG, MR-L and AC interpreted the data. KB, AG, AC, MR-L and CFB contributed to the writing of the final version of the manuscript. All authors agreed with the results and conclusions of this article.
Funding This work was supported by grants from the Lundbeck Foundation (grant No R151-2013-14641) to AG; the Danish Council for Independent Research (grant No DFF-4004-00111) to AG; the European Research Council (grant No 716657] to AG. The Centre for Physical Activity Research (CFAS) is supported by a grant from TrygFonden. The funder of the study had no role in study design, data collection, data analysis, data interpretation or writing of the report. The corresponding author had full access to all of the data in the study and had final responsibility for the decision to submit for publication.
Competing interests MR-L: grants from the Danish Diabetes Academy, funded by the Novo Nordic Foundation, outside the submitted work.
Patient consent for publication Not required
Provenance and peer review Not commissioned; externally peer reviewed.
Data availability statement Code available from the corresponding author (kim.blond.01@regionh.dk). Dataset can also be provided.