Article Text

Abstract
Objective To quantify US female and male Olympic athletes’ longevity and the years of life lost or saved due to multiple causes of death as compared with the US general population.
Methods Former US athletes who had participated in the summer or winter Olympic Games at least once between 1912 and 2012 were included. Olympians’ date of birth, death and the underlying causes of death were certified by the National Death Index. The Olympians’ overall and cause-specific mortality were compared with the US general population based on the US life tables, adjusted by sex, period and age. Mortality differences between the populations were quantified using the years lost/years saved (YS) method.
Results 8124 US Olympians (2301 women and 5823 men) lived 5.1 years longer (YS 95% CI 4.3 to 6.0) than the general population, based on 2309 deaths observed (225 women, 2084 men). Different causes of death contributed to longevity for Olympians as follows: 2.2 years were saved (1.9 to 2.5) from cardiovascular diseases (CVDs); cancer, 1.5 years (1.3 to 1.8); respiratory diseases (eg, influenza, pneumonia), 0.8 years (0.7 to 0.9); external causes (eg, accidents, homicides), 0.5 years (0.4 to 0.6); endocrine and metabolic diseases (eg, diabetes, hyperlipidaemia), 0.4 years (0.2 to 0.5) and digestive system diseases (eg, cirrhosis, hepatic failure), 0.3 years (0.2 to 0.4). Mortality rates due to nervous system disorders (eg, Alzheimer’s and Parkinsons’s diseases) and mental illness (eg, dementia, schizophrenia) were not different from the general population.
Conclusion US Olympians lived longer than the general population, an advantage mainly conferred by lower risks of CVD and cancer. Nervous system disorders and mental illness did not differ between US Olympians and the general population.
- athlete
- Olympics
- longevity
- cardiovascular
- cancer
Statistics from Altmetric.com
Introduction
Elite athletes from different countries appear to have better survival rates compared with the general population.1–6 We have previously quantified the longevity of French Olympians and showed that these elite athletes lived 6.5 years longer than their compatriots, an advantage mainly attributed to a lower risk of cancer.6 From the historical perspective, USA have sent the greatest number of athletes to the Olympic Games (www.sports-reference.com/olympics/countries/) but their longevity has not been investigated. Currently, it is unknown if previous longevity benefits seen in other countries can be extrapolated to Americans given differences in sport culture, geographic-dependent parameters that interfere with life expectancy and lifestyle differences (eg, French paradox on low coronary heart disease).7
Investigating elite athletes’ longevity from different countries allows us to better understand the role of intense physical training on a possible extension of life. In contrast to the widely held view, the relation between high doses of physical activity and long-term consequences on health and mortality is not well established.8 The impact of intense training, particularly on the heart and coronary circulation, is currently debated, and excessive load of physical training may be associated with adverse consequences.9–11 The high prevalence of cardiovascular diseases (CVDs) risk factors in the USA12 reinforces the interest in investigating causes of deaths in US elite athletes. Analyses of health patterns, longevity and causes of death provide important information about the benefits and/or risks that elite athletes are exposed to after their careers are over. Most of the available studies have focused on few diseases.2 3 5 To fully appreciate the consequences of intense sport training, the full contribution of different diseases and risks should be investigated. It remains unclear if the longevity that has been reported for elite athletes results from lower mortality from major cause of deaths (eg, CVDs, cancer) yet hides perhaps greater risks from previously underemphasised causes of deaths (eg, digestive disorders or mental illness).13 We note that very few studies are available on the causes of death in female athletes.1 5 Among US athletes, only male professional athletes’ mortality have previously been evaluated.9 14
The aims of the present study were (1) to quantify US female and male Olympians’ longevity as compared with their referents in the general population and (2) to determine the number of years of life lost or saved due to multiple causes of deaths. We hypothesised that US Olympians would outlive the general population mainly due to a lower CVD toll.
Methods
Study design
A retrospective cohort study of US elite athletes’ longevity and causes of deaths follow-up.
Studied population
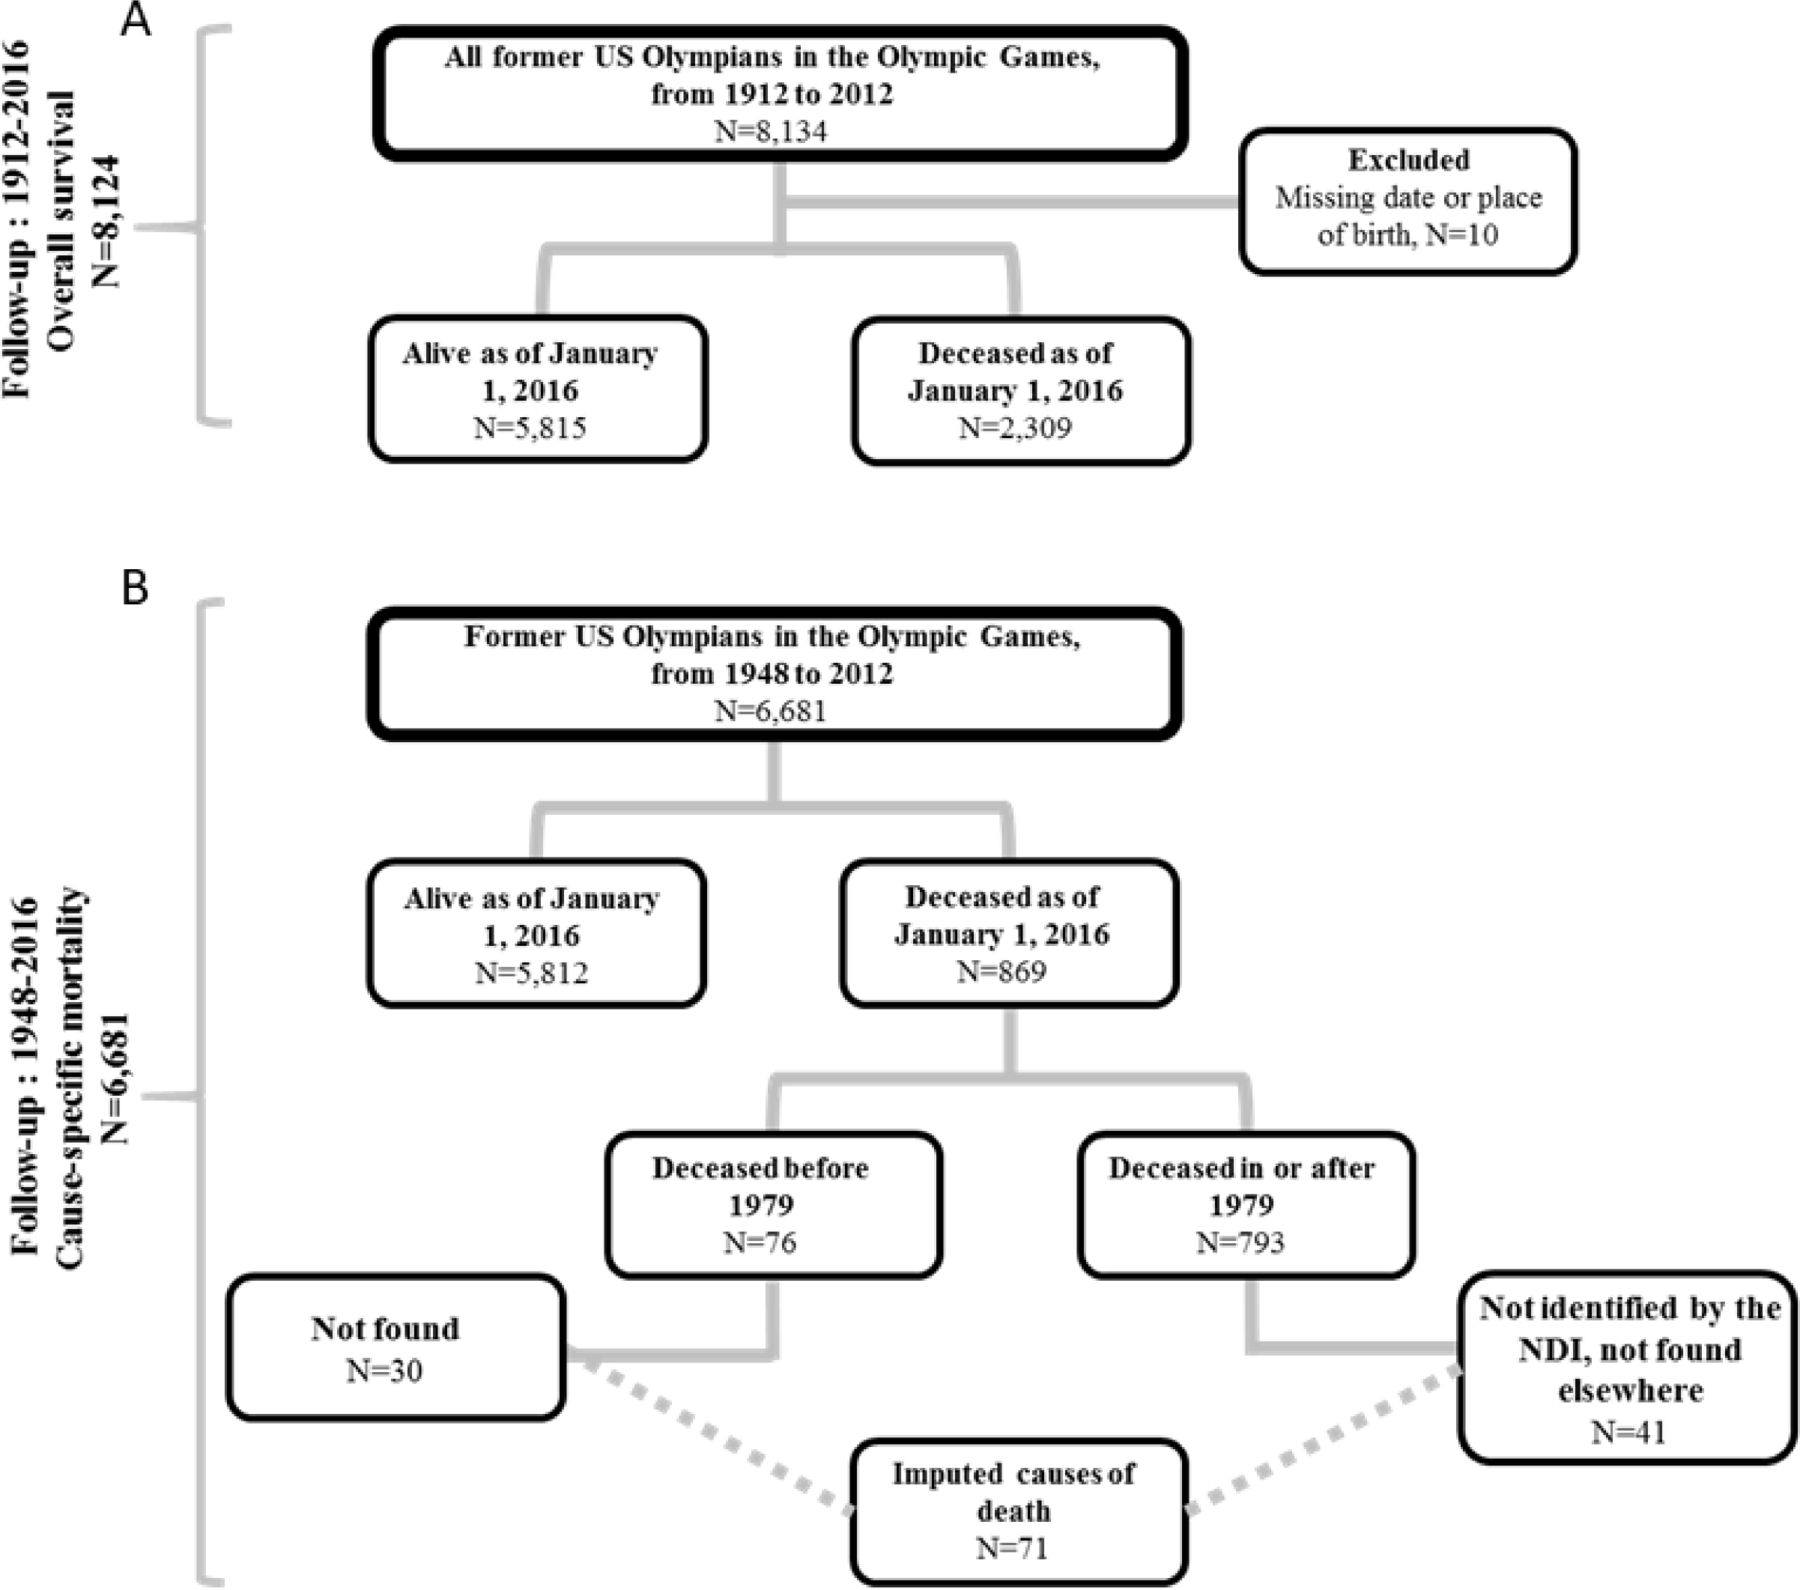
Were included in the follow-up all female and male athletes representing the USA in the summer or winter Olympic Games, at least once, between 1912 and 2012 (figure 1A). Were excluded from the analyses the athletes with missing information regarding their date or place of birth. The athletes’ follow-up started at their first Olympic Games participation and ended at their date of death or at the study’s end point: 1 January 2016.

Flow chart of the US Olympians cohort. (A) Overall survival follow-up. (B) Cause-specific mortality follow-up. NDI, National Death Index.
Data collection
Full name, date and place of birth, and date(s) of Olympic Games participation of all the athletes included were collected from a reliable historians’ database that draws on multiple sources (eg, official Olympic competitors lists, birth registers, newspapers, published obituaries) available online (www.sports-reference.com/olympics).15
The data collected were sent to the NDI for ascertaining Olympians’ life status. For the individuals identified as dead, date and underlying cause of death were obtained. The NDI provided underlying causes of death, beginning in 1979 (when the death register began in the USA), coded to the International Classification of Diseases revision in effect at the time of death (9th revision between 1979 and 1999, 10th revision after 2000). We used the 17 main chapters of the ninth revision to categorise all causes of death: (1) infectious diseases (eg, tuberculosis, HIV); (2) cancer, (3) endocrine and metabolic diseases (eg, diabetes, hyperlipidaemia, amyloidosis); (4) blood diseases; (5) mental disorders (eg, dementia, schizophrenia); (6) nervous system diseases (eg, Alzheimer’s and Parkinsons’s diseases, multiple sclerosis); (7) CVDs (eg, ischaemic heart diseases, cerebrovascular diseases); (8) respiratory system diseases (eg, chronic lower respiratory diseases, influenza, pneumonia); (9) digestive system diseases (eg, fibrosis and cirrhosis of liver, hepatic failure); (10) genitourinary system diseases (eg, nephritis, diseases of genital organs); (11) complications of pregnancy; (12) skin diseases; (13) musculoskeletal diseases; (14) congenital anomalies; (15) conditions originating in the perinatal period; (16) ill-defined conditions; (17) external causes (eg, injuries, accidents, homicides).
To minimise the influence of missing identification of deaths occurring prior to 1979, analyses concerning the causes of death relied only on Olympians competing after World War II from 1948 to 2012 (figure 1B). The deaths occurring before the NDI identification period, or those that were not found by the NDI, were obtained through public sources such as internet, media coverage, or the national sport federation (figure 1B).
Data on the US general population mortality were obtained trough the national life tables, available by the Berkeley Mortality database (http://bmd.mortality.org/) and the Human Mortality database (https://www.mortality.org/). The rates of death causes of the general population was obtained via the Centers for Disease Control and Prevention’s WONDER database (https://wonder.cdc.gov/).16
Data analyses
For overall survival analyses, we performed Kaplan-Meier analyses. The survival curves illustrated the survival probability of the Olympians in comparison with the expected survival based on the mortality rates of the general population.17 We also performed period survival analyses because the follow-up time on the Olympians’ survival was very long in the present study. For these analyses, the survival of the whole Olympians’ cohort was analysed according to six historical periods that are memorable to Olympians.18
In order to quantify longevity gains or losses, we used the years-saved method (YS) previously applied in a cohort of French Olympians.6 First, the cumulative probability of dying was estimated for Olympians using the Aalen-Johansen estimator. Then, this expected probability of death was calculated for the referents in the general population: for each individual in our study, the general population mortality values of individuals of the same sex and calendar year were considered and their values taken for all ages from the time of Olympic game participation until the end of follow-up. In this way, all the comparisons with the general population were adjusted by sex, birth date and periods of follow-up. The average number of years lost/saved was then estimated by calculating the difference of the areas below these two curves. The total number of YS was calculated from the time of the first Olympic participation until the age of death, or the study’s end point or until the age of 90 (this age was chosen to ensure comparability with previous studies and to avoid the problem of overvariability due to data sparsity at high ages19), whichever came first.
The YS method was also employed to isolate the burden of the specific causes of death found among US Olympians, since it is based on the competing risks model. The Aalen-Johansen estimator was used for the observed data and its analogue for the referents in the general population, where the conditional probabilities of death for each separate cause can also be found through the national mortality tables. The method maintains the coherence that the sum of the YS/years lost by each cause corresponds to the total number of years of life saved. This differs from a standard but potentially biassed survival analysis that treats death other than the studied cause as censored—as if the individual were alive.20–22 For causes of deaths analyses, we restricted the analysis to follow the Olympians from age 35 onwards to avoid the problem of different entry times in this more complex analysis (more details on the online supplementary file).
Supplemental material
CIs were stated at the 95% level. A two-tailed p value<0.05 was considered as evidence of statistical significance. We performed sensitivity analyses to account for missing causes of death. Different datasets corresponding to the percentage of missing causes of death were created with imputed causes of deaths.18 The most adjusted model was used to interrogate the data using multiple imputation with chained equations.23 24 Statistical analyses were carried out using the R software V.3.5.3.
Results
A total of 8134 US athletes fulfilled the inclusion criterion (figure 1A). Ten Olympians were excluded because their date and/or place of birth were missing. A total of 2309 deaths (225 women, 2084 men) occurred among the 8124 US athletes (2301 women and 5823 men) whose life status were certified by the NDI. For the Olympians who died, the mean age at death was 72.4±16.1 years. For those who were alive up to 2016, the mean follow-up time was 28.6±16.8 years.
Overall survival
Both female and male US Olympians displayed better survival rates as compared with the general population, and women lived longer than men (figure 2A). The gap in the survival rate that male Olympians displayed in comparison with the general population was greater than that of female Olympians. The median survival time of male Olympians was 56.7 years (95% CI 55.8 to 57.3) after their Olympic participation, while only 30% of their counterparts in the general population lived that long; representing a survival gap of 20% in favour of these athletes. Among female athletes, their median survival time was 66.0 (63.0 to 67.6), and the gap with their female counterparts in the general population of 13%.

(A) Survival probability for former US Olympians with 95% CI (shaded areas) in time since Olympic Games participation, split by sex. Referents from the general population given for comparison (dotted lines). (B) Survival probability by age, reported according to six historical periods. p1, pre-World War I, 1912; p2, between World Wars, 1920–1936; p3, post-World War II and beginning of the Cold War, 1948–1964; p4, Cold War and the Olympic boycotts, 1968–1984; p5, post-Olympic boycotts, 1988–1996; p6, latter, 1998–2012. (C) Cumulative probability of death per age among former US Olympians (green area) and the general population (black curve). Zoom in: cumulative probability of death among Olympians 15 years after their first Olympic Games (OG) participation. (D) Years-saved among US Olympians per age. Zoom in: years saved among Olympians from age 50 onwards.
The Olympians had better survival rates with time, presenting a greater increase after World War II and continuous improvements thereafter (figure 2B), in spite of the higher mortality rates observed in period 3 among younger Olympians. This higher mortality is explained by an air plane crash involving the young figure skating team that had participated in the 1960 Games while heading to a world championship (see online supplementary file for details).
Overall years lost/saved
Olympians demonstrated a lower probability of death (figure 2C) resulting in a total of 5.1 (95% CI 4.3 to 6.0) years of life saved compared with the general population (figure 2D). This longevity advantage is observed as early as the first 15 years after the first Olympic Games participation (figure 2C), and for Olympians 50 years and older (figure 2D).
Years lost/saved per causes of deaths
A total of 6681 Olympians entered the Games between 1948 and 2012 (figure 1B). Among them, a total of 869 deaths occurred before the study’s end point. The overall longevity analysis on this subgroup of Olympians demonstrated a significantly lower probability of death resulting in 5.3 (95% CI 4.9 to 5.8) years of life saved in comparison with the general population.
After death certification, 71 (8%) deaths were missing a cause attribution. The sensitivity analysis performed, based on eight different datasets with the imputed causes of deaths showed no impact on the results after imputation (see online supplementary file for details).
Deaths were observed in all 17 categories of death causes except for the category 11 (complications of pregnancy) and the category 15 (conditions originating in the perinatal period). The mortality rates for these deaths were therefore not included in the analysis.
The cumulative incidence of the observed causes of US Olympians’ deaths are illustrated in figure 3A. Among female (n=2172) and male (n=4509) Olympians, the primary cause of deaths contributing to their greater longevity was a lower risk of CVD (figure 3B and C). Among women, 1.8 years (95% CI 1.3 to 2.3) were saved through premature CVD avoidance and 2.3 years (2.0 to 2.6) among men. The lower risk of cancer deaths contributed to 1.1 (0.5 to 1.8) YS among women and 1.6 (1.3 to 1.9) years among men. The other causes contributing to a greater longevity among US Olympians are (figure 4): a lower risk of death by respiratory diseases YSfemale=0.7 (0.4 to 0.9), YSmale=0.8 (0.7 to 0.9); external causes YSfemale=0.4 (0.3 to 0.5), YSmale=0.6 (0.4 to 0.7); endocrine and metabolic diseases YSfemale=0.4 (0.2 to 0.5), YSmale=0.3 (0.2 to 0.4) and digestive system diseases YSfemale=0.3 (0.2 to 0.4), YSmale=0.3 (0.2 to 0.4). Nervous system diseases YSfemale=0.1 (−0.2 to 0.4), YSmale=−0.1 (−0.3 to 0) and mental illness YSfemale=0.1 (0 to 0.3), YSmale=0 (0 to 0.1) did not contribute significantly to the longevity advantage of the US female or male Olympians. No significant difference was observed in the risk of deaths from such diseases in comparison to the general population (figure 4).
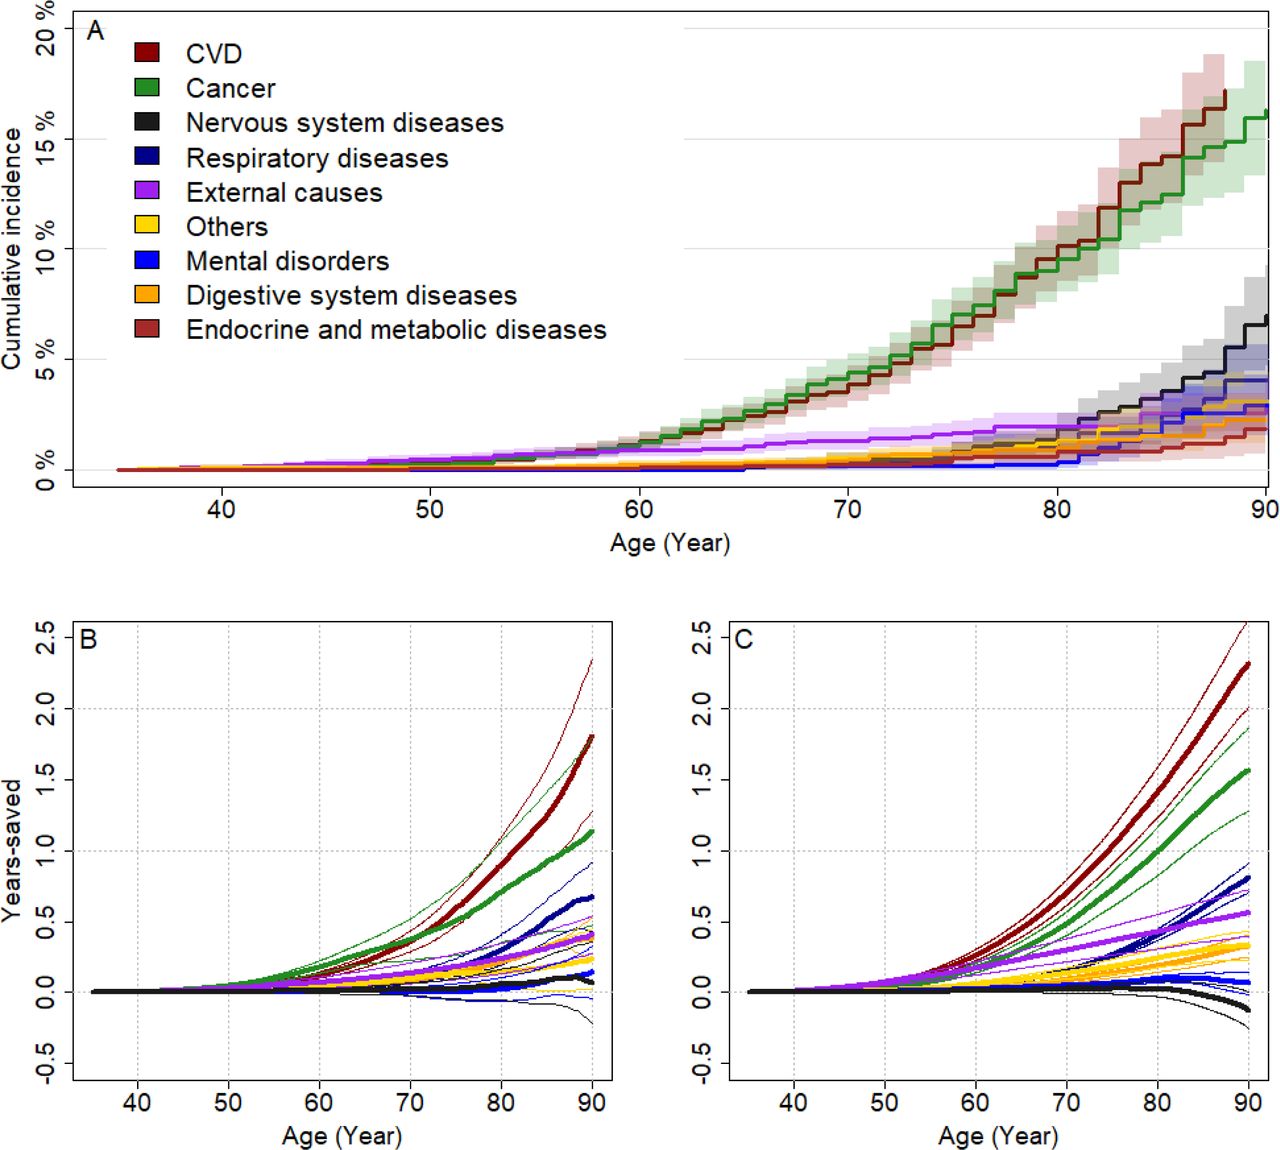
(A) Cumulative incidence of death per causes of deaths observed among US Olympians and its 95% CI (shaded areas). Years-saved per cause of death among female (B) and male (C) US Olympians (thicker lines) and its 95% CI (thinner lines). CVD, cardiovascular disease.
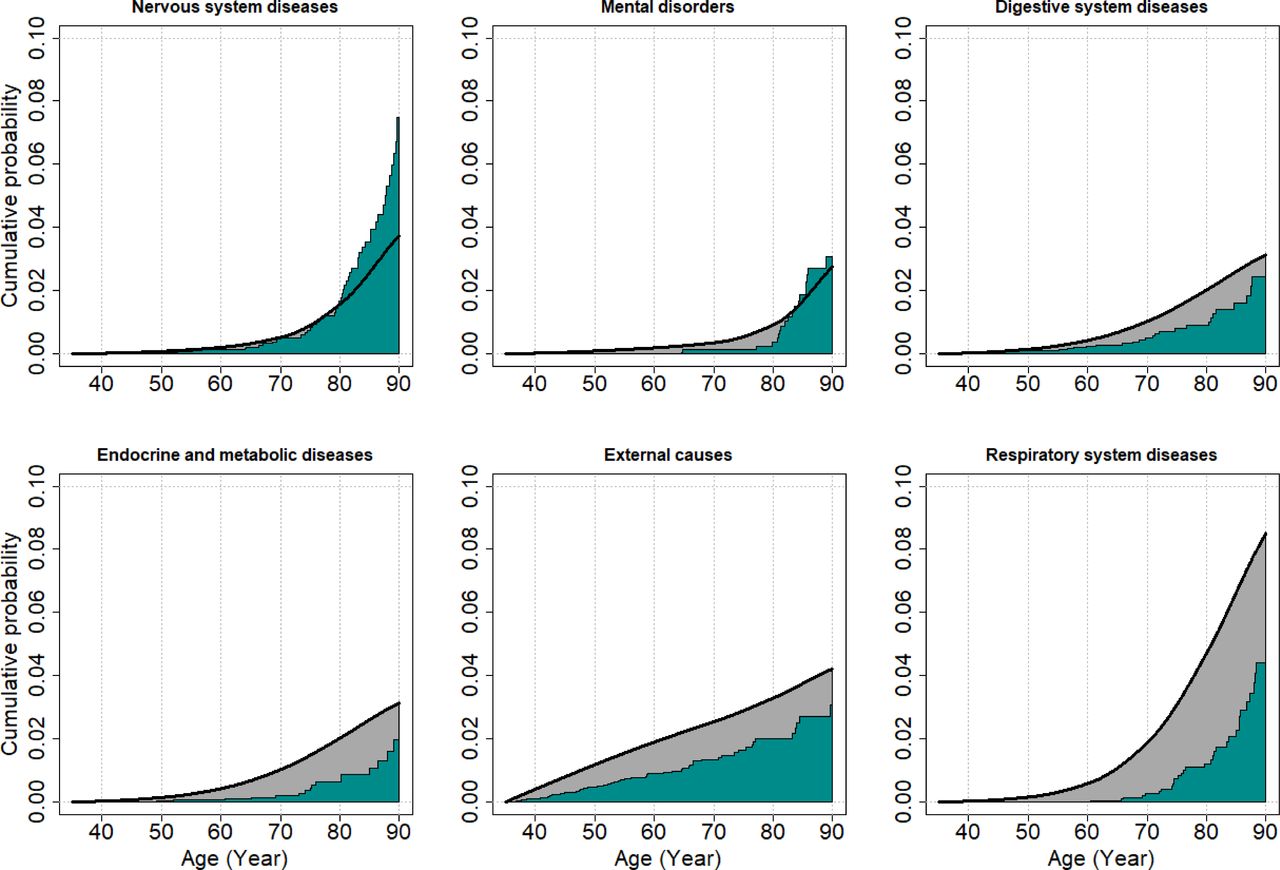
Cumulative probability of death per minor causes of deaths among former US Olympians (blue area) in comparison with the general population (black line).
The impact of each cause of death on the US Olympians’ total longevity is represented in figure 5, after the imputation of the 71 subjects with missing causes of deaths. The sensitivity analysis performed is illustrated in the online supplementary file.

Representation of the impact of each cause of death on the US Olympians’ total longevity before and after imputation. The upper and lower thin lines in the square represent the average of the CIs of each of the eight new data sets built after imputation. The thickest lines represent the average of years-saved calculated after imputation. The discontinued lines represent the years-saved before imputation. The dotted black line represents the longevity of reference based on the general population. CVD, cardiovascular disease.
Discussion
Main findings
The present study demonstrated that former US Olympians lived on average ~5 years longer than their peers in the general population. The survival gap between Olympians and the general population was bigger in men, although female Olympians lived longer than male Olympians. The Olympians’ longevity advantage was mainly attributed to a lower risk of CVD. The other causes impacting the Olympians longevity significantly and positively, according to a decreasing gradient on the number of YS were: cancer, respiratory diseases, external causes, endocrine and metabolic diseases and digestive system diseases. Mental disorders and nervous system disorders, however, did not contribute to the greater longevity observed among US Olympians. The burden of each cause of death on Olympians’ longevity was similar between male and female athletes.
Longevity advantage
The mechanisms underlying the more favourable longevity in former Olympians for each specific cause of deaths is likely to be manifold and interdependent. Please permit us a paragraph of speculation. There is empirical evidence of the anti-inflammatory effects of regular physical activity.25 Chronic inflammation has detrimental consequences on physiological function, increasing the risk of multiple chronic diseases such as CVD and cancer.26 The benefits of regular physical activity echo on the cardiovascular, respiratory, immune, neuronal, metabolic, muscular and skeletal systems.27 The reported mortality reduction in multiple causes for both sexes among Olympians reinforce this concept of multiple organ protection. Besides the intense physical activity that elite athletes devote one quarter of their life to on average, their genetic makeup as well as their lifestyle may contribute to the reduction in mortality. Consider the digestive diseases for instance. An important role that human gut microbiome plays in overall health has been reported.28 A sports performance-enhancing microbe has been found in elite athletes’ gut.29 This illustrates a potential pathway favouring lower risks for diseases and better sports performance.
On the other hand, a higher alcohol consumption has been reported among elite athletes,30 31 which could lead to higher chronic liver diseases,32 while physical activity mitigates risk factors such as obesity or diabetes that are related to digestive diseases.32 This interconnection of multiple factors may have contributed for the lower mortality in the investigated causes of death. This is also true for external causes. A higher socioeconomic status33 likely exposes people to a lower risk of homicides,34 while better and stronger musculoskeletal system (eg, quadriceps strength) is associated with a lower rate of falls.26 35
Comparing results from different nations
Elite athletes of every nationality studied to date have shown a greater longevity compared with their fellow citizens.5 Our recent study showed that French Olympians lived 6.5 years longer.6 Given the slightly lower life expectancy in the USA (<2 years compared with France in the last decades),36 a greater advantage among US Olympians could be expected as the longevity gap would change accordingly to the mortality of the cohort’s reference. However, our present results indicate a slightly lower longevity benefit among US Olympians (a difference of ~1.5 years), reinforcing the idea that the Olympian status does not completely obviate the mortality pressure of the environment. Elite athletes seem to follow the mortality trends observed in the general population but with diminished risks, particularly for the death causes with the greatest mortality rates (eg, CVDs). This is particularly interesting given the fact that the primary cause of death impacting the longevity advantage of US Olympians relates to CVD, while cancer is the main cause underlying the longevity advantage of French Olympians.6 The observations that female Olympians lived longer than male Olympians and that this pattern was the same observed in the general population also reinforces this notion . Another illustration of this phenomenon was the secular trend of Olympians living longer over time, especially after the World War II—a pattern that mirrored that of the US general population.37
Some speculation about physical activity and its dose-response
Elite athletes’ long-term health outcomes may provide a proxy for the physical activity dose-response relation. They represent the highest end of the physical activity load. Previous community-based studies have shown benefits of sport or physical activity on longevity starting with small amounts of regular activity.38 39 A minimum of 15 min/day of exercise was associated with 3 years of greater life expectancy,38 39 and this was mainly attributed to lower cardiovascular mortality.39 The benefits seem to increase with the amount of physical activity following a non-linear fashion.40 There is likely a ceiling for the amount of physical activity regarding the long-term health benefits, but still superior to the training levels of these athletes. A major limitation in us commenting on dose-response is that we were unable to obtain physical activity habits and lifestyle after the athletic retirements in these Olympic athletes.
A cohort selection effect, such as the supposedly good lifestyle habits,41 socioeconomic status as well as a favourable set of genetic and non-genetic predispositions,18 42 likely contributed to the longer lifespan of Olympians. However, the specific contribution of each factor remains unknown. This is true with similar studies in any country, but with the much larger reference population of all American citizens. Clearly, our sample of Olympians is not homogeneous and does not mirror the whole American population. At the time of inclusion the Olympians were probably free of chronic diseases and illnesses that could be found among their peers in the general population, amplifying, therefore, the difference in mortality between the Olympians and the community average.
Nonetheless, the extent of the cohort selection effect might be smaller than previously thought. The large longevity differences that Olympians display with the general population when analysed from 50 years onwards (ie, when the referents in the general population are also selected for their longevity traits) highlights a diminished cohort selection effect. The observation that not all causes of death are lower among Olympians reinforce this notion of a limited cohort selection effect.
Mental and nervous system disorders
The equivalent mortality between US Olympians and their peers concerning mental and nervous system disorders is consistent with the emerging evidence indicating that regular physical activity does not confer a neuroprotection effect.43 Mental and nervous system disorders’ main causes of deaths are the neurodegenerative diseases such as Parkinson’s, Alzheimer’s and dementia. Concerns have been raised about the increased risk of neurodegenerative diseases in professional sports.13 Previous studies have found higher mortality from neurodegenerative diseases in professional American football (NFL) players9 13 and Scottish soccer players.44
In our study, no significant detrimental effect for the nervous system was found. This is consistent with previous studies relying on non-professional athletes.1 Yet, the absence of a mortality gap between Olympians and the general population, considering a potential cohort selection effect favouring Olympians, may highlight a potential risk that need increased clinical attention and medical surveillance.
Limitations and strengths
One limitation of the present study concerns the missing survival adjustments by race, which would have allowed better description of this cohort’s characteristic. However, we had no official information regarding the race of US Olympians. We also acknowledge the missing causes of death in some athletes as another limitation. We attempted to address this limitation by imputing them: the method applied demonstrated that the results were not affected by the missing causes of death, although the magnitude of such findings may have slightly varied. As in all observational studies, the present findings do not allow us to determine any causation effect as we have no information regarding physical activity habits of the former Olympians after the athletic retirement.
Several strengths should be mentioned. This is the first study breaking down the burden of each cause of death in both female and male elite athletes. In addition, the analyses based on the competing risk model allowed for a proper quantification of the total number of YS, and the YS per cause of death without censoring deaths. Finally, the dataset is based on verified data certified by national institutions.
In conclusion, US female and male Olympians lived 5.1 years longer than their peers in the general population. This was mainly associated with a lower rate of premature cardiovascular deaths, contributing to ~2 years of life extension, followed by a lower risk of cancer, which contributed ~1.5 years for both sexes. The decreased death rates from external causes, respiratory, digestive, endocrine and metabolic diseases also contributed to Olympians’ longer lifespan.
What are the findings?
The cohort of 8124 US former female and male Olympians lived 5.1 years longer than the comparable US general population.
This longevity advantage is associated with ~2 years of life saved due to lower premature cardiovascular deaths and ~1.5 years due to a lower risk of cancer.
There were no differences in death rates due to mental and nervous system disorders (eg, neurodegenerative diseases) between Olympic athletes and the general population.
Female Olympians lived longer than male Olympians.
The burden of each cause of death on Olympians’ longevity was similar between male and female Olympians.
Acknowledgments
The authors would like to thank the Institut National du Sport, de l’Expertise et de la Performance (INSEP), the University of Texas at Austin and the Slovenian Research Agency (the project 'Years of life lost as a measure of disease burden', No. J3-1761) for their full support. The authors also thank Stephanie Duncombe for reviewing the paper.
References
Footnotes
Contributors JA designed the study, analysed the data and wrote the manuscript, MP-P analysed the data and reviewed the paper, QDL analysed the data, HT collected the data and reviewed the paper, J-FT designed the study and reviewed the paper.
Funding This work was supported by grant from the Assistance Publique-Hôpitaux de Paris (AP-HP).
Competing interests None declared.
Patient and public involvement Patients and/or the public were involved in the design, conduct, reporting or dissemination plans of this research. Refer to the 'Methods' section for further details.
Patient consent for publication Not required.
Ethics approval The protocol for the present study was approved by the Institutional Review Board at the University of Texas at Austin and was assigned to the approval number 2015-03-0035. The data were strictly subjected to the confidential data control plan according to the specification set by the NDI.
Provenance and peer review Not commissioned; externally peer reviewed.
Data availability statement Data regarding death certification is strictly subjected to the confidential data control plan according to the specification set by the National Death Index.