Article Text

Abstract
Objectives To provide sex- and age-specific normative values for health-related fitness of 9–17-year-old Australians.
Methods A systematic literature search was undertaken to identify peer-reviewed studies reporting health-related fitness data on Australian children since 1985—the year of the last national fitness survey. Only data on reasonably representative s amples of apparently healthy (free from known disease or injury) 9–17-year-old Australians, who were tested using field tests of health-related fitness, were included. Both raw and pseudo data (generated using Monte Carlo simulation) were combined with sex- and age-specific normative centile values generated using the Lambda Mu and Sigma (LMS) method. Sex- and age-related differences were expressed as standardised effect sizes.
Results Normative values were displayed as tabulated percentiles and as smoothed centile curves for nine health-related fitness tests based on a dataset comprising 85347 test performances. Boys typically scored higher than girls on cardiovascular endurance, muscular strength, muscular endurance, speed and power tests, but lower on the flexibility test. The magnitude of the age-related changes was generally larger for boys than for girls, especially during the teenage years.
Conclusion This study provides the most up-to-date sex- and age-specific normative centile values for the health-related fitness of Australian children that can be used as benchmark values for health and fitness screening and surveillance systems.
Statistics from Altmetric.com
Background
Physical fitness is considered to be an important marker of current and future health in children and adults.1 In children, cardiovascular fitness is a weak-to-strong predictor of total and abdominal adiposity, cardiovascular disease risk factors, cancer and mental health.1 ,2 Certain muscular fitness components (eg, strength and endurance) are moderate predictors of cardiovascular disease risk factors, skeletal health and mental health.1 Meaningful relationships have also been reported between running speed (another muscular fitness component) and skeletal health.3 In adults, cardiovascular fitness is a strong and independent predictor of all-cause mortality and cardiovascular disease mortality and morbidity,4 stroke,5 cancer, mental health,6 health-related quality of life7 and many other cardiometabolic risk factors and comorbidities.8 ,9 Moreover, physical fitness tracks moderately well from childhood through to adulthood.10,–,13 This evidence highlights the need to include health-related fitness testing (ie, the testing of fitness components such as cardiovascular and muscular fitness that have the strongest links with health outcomes) as part of existing health and fitness screening and surveillance systems.
Although the most valid assessments of fitness require sophisticated laboratory equipment and a high level of tester expertise, they unfortunately are not suitable for mass testing. On the other hand, properly conducted field tests offer simple, feasible, and practical alternatives, which typically demonstrate good reliability and validity.2 ,14,–,17 In Australia, unlike in Europe and North America where standardised test batteries such as the Eurofit18 or FITNESSGRAM19 are widely administered, a number of different field-based fitness tests and testing protocols have been used over time. For example, the most popular field test of cardiovascular fitness in Australia in the 1960s and 1970s was the 549-m (600 yd) run; in the 1980s and 1990s, it was the 1600-m run; and over the past decade or so, it has been the 20-m shuttle run.20 Many physical educators and sports coaches in Australia continue to administer tests that are no longer in favour, largely because normative data (which are now several decades old) are available. This makes it difficult to assess the current status of health-related fitness in Australian children. Further compounding the problem is that the last national fitness survey of Australian children was conducted in 1985,21 and with convincing evidence of recent temporal changes in several components of fitness,22,–,24 the usefulness of such data seems to be limited.
Because there has never been a follow-up to the 1985 national survey, this study aimed to locate large and reasonably representative datasets of Australian children to generate normative centile values for health-related fitness. This study also aimed to quantify sex- and age-related differences in health-related fitness. These normative data will facilitate the identification of children with (a) low fitness in order to set appropriate goals and to promote positive health behaviours, and (b) specific fitness characteristics that may be considered important for sporting success.
Methods
Data sources
A systematic review of the peer-reviewed scientific literature was undertaken to locate studies reporting descriptive summary data on Australian children tested for health-related fitness using field tests. Candidate studies were searched for in November 2009 using a computer search of online bibliographic databases (Ausport, CINAHL, Medline, PubMed, Scopus and SPORTDiscus). The search string used for the computer search was: ((((((((((((((((fitness) OR aerobic) OR anaerobic) OR cardio*) OR endurance) OR agility) OR flexibility) OR speed) OR power) OR strength) OR sprint*) OR jump*) OR push-up*) OR sit-up*) OR grip strength) OR sit and reach) AND (((((((child*) OR paediatric*) OR adolesc*) OR boy*) OR girl*) OR youth*) OR teen*) AND (Australia*). All titles and abstracts (when available) were assessed to identify eligible articles, with full-text articles retrieved if there was doubt in an article's eligibility. A number of Australian researchers were contacted through email to ask whether they knew of any appropriate studies or unpublished datasets.
Inclusion/exclusion criteria
Studies were included if they explicitly reported descriptive health-related fitness test data for apparently healthy (free from known disease or injury) 9–17-year-old Australians who were tested from 1985 onwards and if they reported data at the sex by age by test level, on children directly measured using field-based fitness tests for which explicit testing protocols were available. Studies were excluded if they reported descriptive data that were published in another identified study. The reference lists of all included studies were examined and cross-referenced to identify additional studies. Attempts were made to contact the corresponding author of each study to request raw data and/or to clarify study details.
Initial data analysis
The following descriptive data were extracted from each included study: sex, age, year of testing, sample size, mean, SD, fitness test type and test protocol. Only data for commonly used fitness tests that were collected using protocols that were originally described in national or state-based fitness surveys of Australian children were retained for further analysis. Tests were considered to be ‘common’ if they were used to measure fitness in children across a broad range of ages and in at least two separate studies. Data for each fitness test were expressed in a common metric, and protocol differences were corrected where possible (eg, 20 m shuttle run data were expressed as the number of completed stages using the correction procedures described by Tomkinson et al).25 However, if protocol correction was not possible, then only fitness data collected using the most common test protocol were retained. All available raw data were checked for anomalies by running range checks with data ±3 SDs away from the respective study by sex by age by test mean excluded. Age was expressed in whole years as the age at last birthday.
Statistical analysis
Sex- and age-specific normative centile values were calculated using a dataset comprising raw data and pseudo data that were generated using the method described by Tomkinson.24 Normative centile values were generated using LMSChartmaker Light (v2.3, The Institute of Child Health, London) software, which analyses data using the LMS method.26 The LMS method fits smooth centile curves to reference data by summarising the changing distribution of three sex- and age-specific curves representing the skewness (L: expressed as a Box-Cox power), the median (M) and the coefficient of variation (S). Using penalised likelihood, the curves can be fitted as cubic splines using non-linear regression, and the extent of smoothing required can be expressed in terms of smoothing parameters or equivalent degrees of freedom.27
For each fitness test, differences in means between: (a) age-matched Australian boys and girls (eg, 10-year-old boys vs 10-year-old girls); (b) sex-matched Australian children of different ages (eg, 10-year-old boys vs 11-year-old boys); and (c) sex- and age-matched Australian and international children18 ,28,–,30 were expressed as standardised effect sizes.31 Positive effect sizes indicated that mean fitness test performances for boys (age-matched analysis), older children (sex-matched analysis) or Australian children (sex- and age-matched analysis) were higher than those for girls, younger children or international children, respectively. Effect sizes of 0.2, 0.5 and 0.8 were used as thresholds for small, moderate and large.31
Results
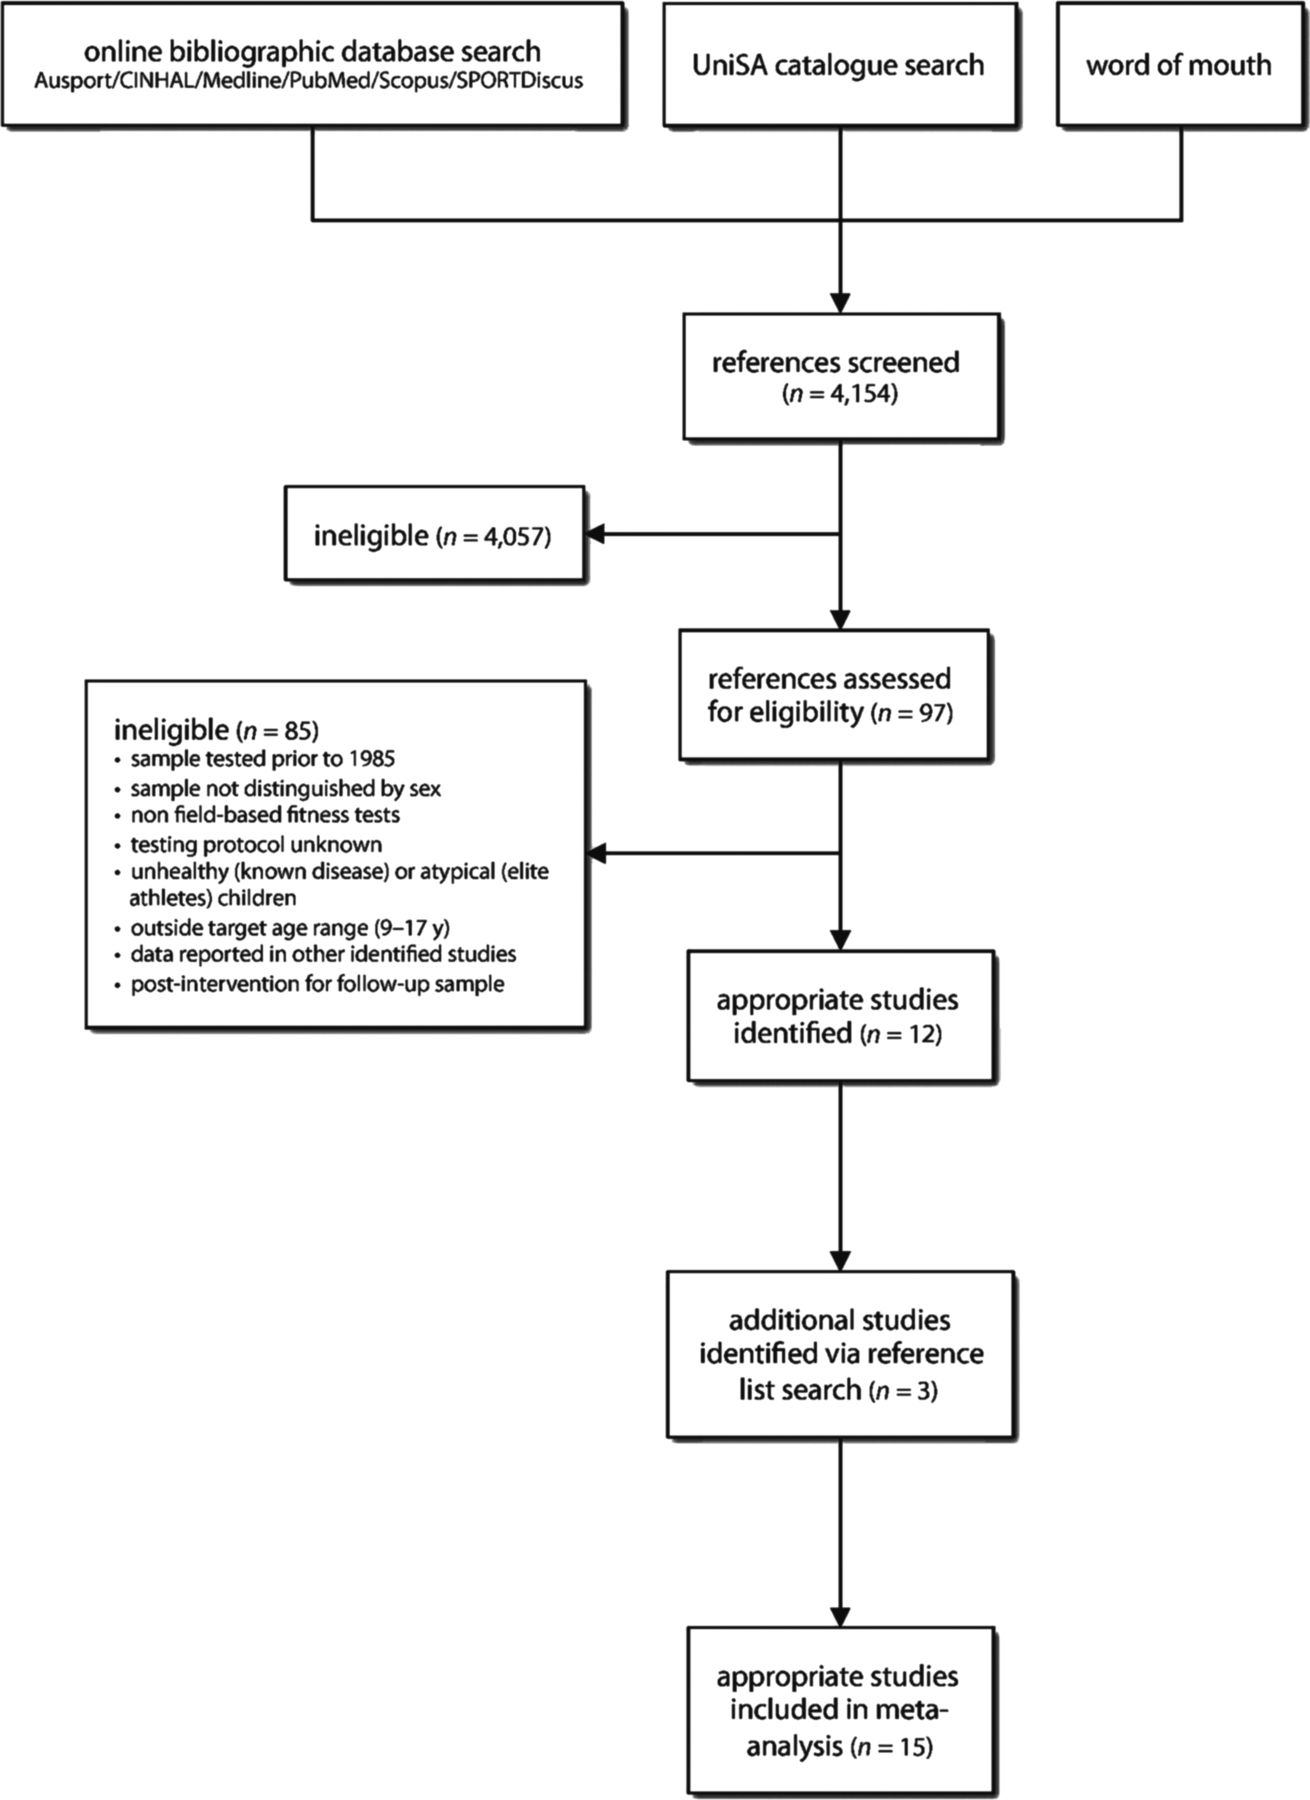
Table 1 summarises the 15 included studies. Of these, 12 were identified through bibliographic database searching and word of mouth, and three were identified through reference list searching. Corresponding authors of all the studies were contacted through email to clarify study details and/or to request raw data. All authors satisfactorily clarified study details, and seven of them supplied raw data (figure 1).

Flowchart outlining the identification of the included studies.
Summary of the included studies that have been used to assess the health-related fitness of 9–17-year-old Australians since 1985
The final dataset comprised 85347 individual test results and 142 sex by age by test groups with a median sample size of 537 (range: 54–2612). Data were available for six fitness components and nine fitness tests: cardiovascular endurance (20 m shuttle run, 1.6 km run), muscular strength (hand-grip), muscular endurance (push-ups and sit-ups), muscular power (standing broad jump and basketball throw), muscular speed (50 m sprint) and flexibility (sit-and-reach). Raw data were available for 74% of all data points.
Normative fitness data for 9–17-year-old Australians are presented as tabulated percentiles from 5 to 95 (P5, P10, P20, P30, P40, P50, P60, P70, P80, P90, P95) in tables 2–10. The sex- and age-specific LMS values for all fitness tests are also shown. The LMS values depict the nature of the age-related distributions for boys and girls and can be used to calculate z-scores and hence percentile values by looking up a z-table, using the following formula:
1.6 km run (s) centile values and LMS summary statistics by sex and age in 9- to 17-year-old Australians
20 m shuttle run (completed stages) centile values and LMS summary statistics by sex and age in 9- to 17-year-old Australians
50 m sprint (s) centile values and LMS summary statistics by sex and age in 9- to 15-year-old Australians
Basketball throw (m) centile values and LMS summary statistics by sex and age in 9- to 17-year-old Australians
Standing broad jump (cm) centile values and LMS summary statistics by sex and age in 9- to 15-year-old Australians
Push-ups (no. in 30 s) centile values and LMS summary statistics by sex and age in 9- to 15-year-old Australians
Sit-ups (no. in 180 s) centile values and LMS summary statistics by sex and age in 9- to 17-year-old Australians
Hand-grip strength (kg) centile values and LMS summary statistics by sex and age in 9- to 15-year-old Australians (taken as the mean of both hands)
Sit-and-reach (cm) centile values and LMS summary statistics by sex and age in 9- to 17-year-old Australians.
where z is z score, x is performance, L is sex- and age-specific L-value, M is the sex- and age-specific M-value and S is the sex- and age-specific S-value.
Figures 2 and 3 show the smoothed centile curves (P10, P50, P90).

Smoothed centile curves (P10, P50 and P90) for (A) 1.6 km run (s), (B) 20 m shuttle run (number of completed stages), (C) 50 m sprint (s), (D) basketball throw (m) and (E) standing broad jump (cm).

Smoothed centile curves (P10, P50 and P90) for (A) push-ups (number in 30 s), (B) sit-ups (number in 180 s), (C) hand-grip strength (kg) and (D) sit-and-reach (cm) tests.
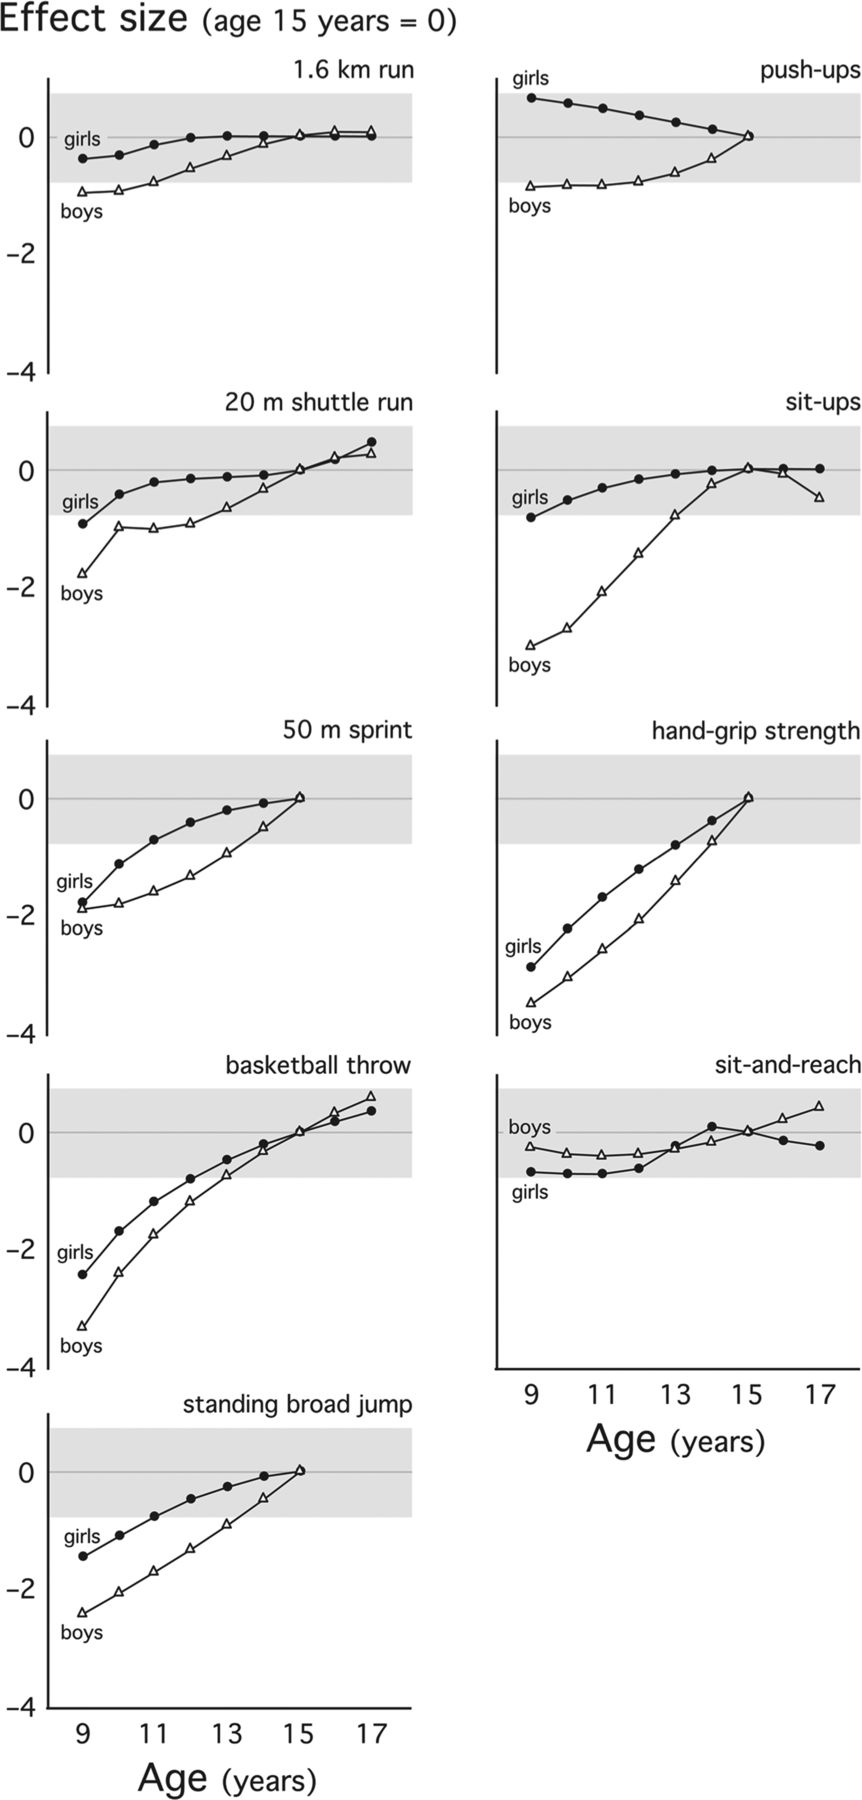
Figure 4 shows the sex-related differences in mean fitness. Boys consistently scored higher than girls on health-related fitness tests, except on the sit-and-reach test, with the magnitude of the differences typically increasing with age and often accelerating from about 12 years of age. Overall, the magnitude of differences between boys and girls was large for the 1.6 km run, 20 m shuttle run, basketball throw and push-ups; moderate for the 50-m sprint, standing broad jump and sit-and-reach; and small for sit-ups and hand-grip strength. Figure 5 shows the age-related changes in mean fitness. The age-related changes were typically larger for boys than for girls, especially during the teenage years, and for muscular fitness tests than for cardiovascular fitness tests. Fitness also tended to peak from about the age of 15 years. Figure 6 shows that the differences in health-related fitness between Australian and international children were generally small, with Australian children scoring slightly higher on hand-grip strength (mean ±95% CI: 0.20±0.03 SDs) and 50 m sprint tests (0.24±0.02 SDs), and slightly lower on sit-and-reach (−0.36±0.02 SDs), standing broad jump (−0.25±0.02 SDs) and 20 m shuttle run tests (−0.49±0.01 SDs).

Sex-related differences in mean fitness expressed as effect sizes. Data are shown for 9–17-year-old children tested on the (A) 1.6 km run, (B) 20 m shuttle run, (c) 50 m sprint, (D) basketball throw, (E) standing broad jump, (F) push-ups, (G) sit-ups, (H) hand-grip strength and (I) sit-and-reach tests. The limits of the grey zone represent effects sizes of 0.8 and –0.8, beyond which large differences are observed.

Age-related changes in mean fitness expressed as effect sizes standardised to an effect size of age 15 years=0. Data are shown for 9–17-year-old boys (triangles) and girls (circles) separately tested on the (A) 1.6 km run, (B) 20 m shuttle run, (C) 50 m sprint, (D) basketball throw, (E) standing broad jump, (F) push-ups, (G) sit-ups, (H) hand-grip strength and (I) sit-and-reach tests. The limits of the grey zone represent effects sizes of 0.8 and –0.8, beyond which large differences are observed.

Sex- and age-specific effect sizes for (A) 20 m shuttle run, (B) 50 m sprint, (C) hand-grip strength, (D) sit-and-reach and (E) standing broad jump for 9–17-year-old Australian boys (triangles) and girls (circles) relative to their international peers. Positive effects indicate higher fitness scores for Australian children and negative effects indicate lower fitness scores. Comparative data represent n=284 508 20 m shuttle run performances,28,–,30 n=1 216 452 50 m sprint performances,18 n=126 361 hand-grip strength performances,29 n=102 664 sit-and-reach performances,29 and n=164 986 standing broad jump performances29 of 9–17-year-old children from 48 international countries.
Discussion
This study provides the most up-to-date sex- and age-specific normative centile values for 9–17-year-old Australians across a range of health-related fitness tests, which can be used as benchmark values for health and fitness screening and surveillance of children. These data complement a growing literature reporting growth percentiles across a range of different health measures, such as body mass index,32 waist girth33 and blood pressure,28 and a range of other health-related fitness measures.29 ,30 It also quantifies the magnitude and direction of sex- and age-related differences in children's health-related fitness and shows that boys consistently scored higher than girls on fitness tests (except on the sit-and-reach test of flexibility) and that boys experience larger age-related changes in fitness. The developmental patterns of children's fitness have been well studied and extensively reviewed (eg, for cardiovascular fitness, refer to Armstrong et al,34 Krahenbuhl et al35 and Rowland36; for muscular fitness, refer to Blimkie and Sale,37 Froberg and Lammert38 and De Ste Croix39). Although the underlying causes of sex- and age-related differences are clear for some fitness test performances, such as those for muscular strength, power and speed, which are largely explained by physical differences (eg, differences in muscle mass or height), they are less clear for others, such as for cardiovascular endurance, which may be explained by physiological differences (eg, differences in mechanical efficiency and/or fractional utilisation).15 ,36 It is, nonetheless, beyond the scope of this article to discuss the causes that underscore the sex- and age-related changes in fitness test performance.
International comparisons
Although several studies have previously compared the health-related fitness of Australian children with their sex- and age-matched international peers,20 ,40 comparisons have only been made for cardiovascular fitness. Figure 6 compares the 20-m shuttle run, 50 m sprint, standing broad jump, hand-grip strength and sit-and-reach performance of 9–17-year-old Australians with 1 894 971 test results from sex-, age- and test-matched international children from 48 countries who have been measured using the same test protocols as those referenced in table 1 and described in Appendix 1. Figure 6 also shows typically small differences in health-related fitness between Australian and international children. Furthermore, the sex- and age-related differences in fitness of Australian children are strikingly similar to those observed in international children. Given that the differences are generally small, the normative centile data presented in this study could be used as approximate benchmark values for health-related fitness of international children.
Fitness thresholds for cardiometabolic risk
Fitness is widely recognised as a powerful marker of current and future cardiovascular, skeletal and mental health. Unfortunately, there are no universally accepted recommendations for health-related levels of fitness. In recent years however, sex- and age-specific threshold values for cardiovascular fitness (operationalised as mass-specific peak oxygen uptake in ml/kg/min) have been established for European and US children using linked cardiometabolic risk-based values from receiver operator characteristic curve analyses.41,–,44 To estimate the prevalence of Australian children with ‘healthy’ cardiovascular fitness (ie, those above the thresholds), ‘international’ sex- and age-specific thresholds for 9–17-year-old children were estimated by determining best-fitting polynomial regression model (quadratic or cubic) relating age (predictor variable) to previously reported threshold values (response variable) in Adegboye et al,41 Lobelo et al,42 Ruiz et al43 and Welk et al.44 Separate models were generated for boys and girls. Peak oxygen uptake values in Australian children were estimated using 1.6 km run and 20 m shuttle run data and the Cureton et al45 and Léger et al46 regression equations, respectively.
Using these thresholds, about 71% of Australian boys (median ±95% CI: 71%±8%) and 77% of Australian girls (median ±95% CI: 77%±10%) apparently have ‘healthy’ cardiovascular fitness. Although in light of recent secular declines in cardiovascular fitness,20 ,22 ,23 ,25 and with a median testing year of 1993 in this study's cardiovascular fitness dataset, it is likely that these prevalence rates somewhat overestimate those of today. These prevalence rates are better than (for girls), or similar to (for boys), those observed in European (61% of boys and 57% of girls)29 and US (71% of boys and 69% of girls)42 children. Geographical differences in prevalence rates may reflect differences in (a) threshold levels, (b) the year(s) of testing, (c) sampling methodology, (d) test methodology and (e) the way in which peak oxygen uptake was measured or estimated.47
Ultimately, it is important to remember that the normative data presented in this study show how well Australian children perform on health-related fitness tests relative to their sex- and age-matched peers. For example, using a percentile classification, children with fitness in the bottom 20% can be classified as having ‘very low’ fitness; those between the 20th and 40th percentiles as having ‘low’ fitness; those between the 40th and 60th percentiles as having ‘average’ fitness; those between the 60th and 80th percentiles as having ‘high’ fitness; and those above the 80th percentile as having ‘very high’ fitness. These data are not criterion-referenced in that they do not indicate whether children with ‘very low’ or ‘low’ (or any other classification for that matter) have ‘unhealthy’ cardiovascular fitness or increased cardiometabolic risk. Despite the fact that previous Australian evidence has linked low childhood cardiovascular fitness with increased cardiometabolic risk in adulthood,48 future Australian studies are required to examine whether childhood thresholds for cardiovascular fitness (or other health-related fitness components) are significantly associated with clustered cardiometabolic risk (or other health outcomes, such as mental or skeletal health outcomes).
Strengths and limitations
Despite the fact that the last national fitness survey of Australian children was in 1985, this study provides the most up-to-date normative dataset for nine widely administered health-related fitness tests, using cumulated data from 85347 Australian children aged 9–17 years collected between 1985 and 2009. This study used a strict set of inclusion and exclusion criteria and rigorous initial data analysis procedures to systematically control for any factors (eg, differences in test methodology) that might have biased the normative values or the estimates of the sex- and age-related differences. It used a novel pseudo-data method to allow both descriptive and raw data to be merged before using the LMS method to create sex- and age-specific smoothed percentiles. It also quantified sex- and age-related differences as standardised effects sizes, allowing for comparison between sexes, among different ages, and with sex, age and test-matched international children.
However, this study is not without limitations. Only one of the 15 included studies was based on a nationally representative sample, which obviously raises the issue of representativeness. Most of the included studies used similar sampling frames (table 1). Schools with a greater interest in sport and fitness may have been more willing to participate, and because participation at the individual level was voluntary, it is possible that children with low fitness levels chose not to participate. This might have resulted in fitness test performances unrepresentative of the population, but it should not have affected the sex- and age-related differences. Fitness data were also collected at different times during the 1985–2009 period, and given convincing evidence of recent temporal declines in some (but not all) components of Australian children's fitness,23 ,49 it is possible that the normative data presented in this study represent a better ‘health-related picture’ than what would be observed today. A temporal analysis of the data accumulated in this study suggests that these normative data would probably overestimate the fitness of Australian children in 2009 by an average of 0.3 SDs or 13 percentile points, assuming of course that the observed temporal changes remained consistent across the entire 1985–2009 period. Nonetheless, these data represent the best available and most up-to-date health-related fitness data on Australian children. It must also be remembered that despite being simple, cheap, easy, reliable, reasonably valid and widely used alternatives of laboratory-based criterion measures, field tests are affected by factors other than underlying construct fitness. For example, validity data for field tests of cardiovascular fitness suggest that (at best) only 50–60% of the variance in field test performance is explained by the variance in underlying peak oxygen uptake, indicating that other physiological, physical, biomechanical, psychosocial and environmental factors also play a part.15 In addition, although criterion-related validity has not been established for all of the included tests, face validity is generally accepted.17 Most of the included tests are also considered to demonstrate good reliability, although tests requiring a reasonable degree of subjective judgement (eg, the subjective scoring of a properly performed sit-up or push-up) typically demonstrate poorer reliability.14
Conclusion
Physical fitness is considered to be an excellent marker of current and future health. In anticipation of a follow-up national fitness survey, this study provides the most up-to-date and most comprehensive set of sex- and age-specific normative centile values of health-related fitness of Australian children, which can be used as benchmark values for health and fitness screening and surveillance systems. These normative centile values will facilitate the identification of children with low fitness to set appropriate fitness goals, monitor individual changes in fitness and promote positive health behaviours. They will also facilitate the identification of children who possess specific fitness characteristics that may be considered important for sporting success, in the hope of recruiting the high achievers into elite sporting development programs.
Acknowledgments
The authors thank the authors of the included studies for generously clarifying details of their studies and/or for providing raw data. The University of South Australia Divisional Development Research Scheme supported this study.
References
Supplementary materials
Supplementary Data
This web only file has been produced by the BMJ Publishing Group from an electronic file supplied by the author(s) and has not been edited for content.
Files in this Data Supplement:
- Web Only Data - This web only file has been produced by the BMJ Publishing Group from an electronic file supplied by the author(s) and has not been edited for content.
Footnotes
-
Correction notice This article has been corrected since it was published Online First. The authors have noticed that the normative data in Table 10 are incorrect. The correct table has been inserted.
-
Competing interests None.
-
Provenance and peer review Not commissioned; externally peer reviewed.
-
▸ References to this paper are available online at http://bjsm.bmjgroup.com