Article Text

Abstract
Objectives: To investigate to what extent bone mass accrual is determined by physical activity and changes in lean, fat, and total body mass during growth.
Methods: Twenty six physically active and 16 age matched control boys were followed up for three years. All subjects were prepubertal at the start of the survey (mean (SEM) age 9.4 (0.3) years). The weekly physical activity of the active boys included compulsory physical education sessions (80–90 minutes a week), three hours a week of extracurricular sports participation, and occasional sports competitions at weekends. The physical activity of the control group was limited to the compulsory physical education curriculum. Bone mineral content (BMC) and areal density (BMD), lean mass, and fat mass were measured by dual energy x ray absorptiometry.
Results: The effect of sports participation on femoral bone mass accrual was remarkable. Femoral BMC and BMD increased twice as much in the active group as in the controls over the three year period (p<0.05). The greatest correlation was found between the increment in femoral bone mass and the increment in lean mass (BMC r = 0.67 and BMD r = 0.69, both p<0.001). Multiple regression analysis revealed enhancement in lean mass as the best predictor of the increment in femoral bone BMC (R = 0.65) and BMD (R = 0.69).
Conclusions: Long term sports participation during early adolescence results in greater accrual of bone mass. Enhancement of lean mass seems to be the best predictor of this bone mass accumulation. However, for a given muscle mass, a greater level of physical activity is associated with greater bone mass and density in peripubertal boys.
- BMC, bone mineral content
- BMD, bone mineral density
- DXA, dual energy x ray absorptiometry
- bone mass
- children
- exercise
- health
- growth
Statistics from Altmetric.com
The proximal femur is one of the most clinically relevant zones associated with osteoporotic related fractures.1 There is some evidence that the peak bone mass attained during adolescence is probably an important determinant of bone fracture risk later in life.1 Peak bone mass is normally attained between 20 and 30 years of age in men.2 It has been suggested that a higher peak bone mass may be achieved by regularly performing weight bearing exercise, particularly if associated with impacts, during growth.3,4 A three year longitudinal study clearly showed that weight bearing sports activities, involving rapid directional changes, starts, stops, and large ground reaction forces, promote continued bone accretion in young men aged between 16 and 19 years.5 We have also observed in a cross sectional study that prepubertal boys involved in these kinds of activity had higher bone mineral content (BMC) and bone mineral density (BMD) than age and weight matched, non-physically active counterparts.6 However, the mechanisms by which the growing skeleton is more sensitive to mechanical stress than adult bone remain elusive.7 Previous studies have documented associations of total body and lean mass with BMC and BMD.6,8,9,10,11,12,13,14 Ferretti et al,9 from a study of 1450 subjects aged 2–87 years, reported that muscle mass and bone mass are closely related throughout life, and total lean body mass is the strongest determinant of whole body BMC. These relations can be explained by the mechanostat theory, which proposes that bone strength is regulated by modelling and remodelling processes depending on the forces acting on the bones.8,12,15,16 Thus sports activities that involve tensile, compressive, shear, bending, and torsional stresses on bones can elicit mechanostat related mechanisms.16–18 Other studies have shown that fat mass is positively related to bone mass in the upper extremities of women.19 However, the strength of this relation is lower than between bone and lean mass.19,20 Although body weight has been identified as a determinant of BMD, some controversy exists over the independent effect of the major components, lean and fat mass.21 Lean mass has been shown to be a better predictor of total BMD than body weight in children.22 Also, fat mass is closely correlated with bone mass.23 Sports participation is another factor that may influence both bone mass and body composition.
Data on these matters are very limited in boys, but they are crucial for us to know whether exercise programmes should aim at developing muscle mass (by inducing muscle hypertrophy) or just elicit a certain level of mechanical stress to maintain or increase bone mass and density. However, there are no longitudinal studies on the relation between changes in body composition on the one hand and the increment in either femoral BMC and/or BMD on the other, and the influence of physical activity on this relation in prepubertal boys.
In this study we aimed to find out if increases in femoral bone mass and density are related to changes in soft tissue body composition, and to ascertain to what extent bone mass accrual is determined by changes in lean, fat, and total body mass during growth.
METHODS
Subjects
Forty two prepubertal boys (Tanner stages 1–2) from different schools and sports clubs on the island of Gran Canaria agreed to enrol in the study. The final admission to the study occurred once written informed consent had been obtained from the parents. The subjects represented a subgroup of the boys included in the growth and physical activity study of Gran Canaria.6 Parents and children were informed about the aims and procedures of the investigation protocol, as well as the possible risks and benefits before they gave their written consent. The study was carried according the Helsinki Declaration, and was approved by the ethics committee of the University of Las Palmas de Gran Canaria.
The subjects were divided into two groups depending on the level of their usual physical activity. Twenty six were placed in the active group as, in addition to compulsory physical education sessions (80–90 minutes a week), they participated regularly in extracurricular sports activities. At the beginning of the study, all of them were footballers, having played for at least one year (mean (SEM) 2.0 (0.25) years) and at least three hours a week. At the end of the follow up, one subject changed his sport from football to basketball, and another two changed from football to handball. The other 16, whose physical activities were limited to the compulsory physical education curriculum (80–90 minutes a week), were enrolled as a control group. The boys answered a medical and physical activity questionnaire, and their parents gave additional medical information. Each subject provided information on physical activity, past injuries, medication, known diseases, and daily consumption of dairy products, the latter to allow calculation of daily calcium intake. Chronic diseases that may influence physical activity or bone mass as well as any drugs that may affect the skeleton were defined as exclusion criteria. No subject presented exclusion criteria. All tests were carried out on two different occasions: at the start of the study and a mean of 3.3 years later.
Training exercises and their possible effects on bone
In general, team sport training sessions lasted for one hour and included about 10 minutes of low intensity games and stretching exercises, 10–25 minutes of technical sports exercises (kicking, throwing, dribbling, jumping, and running with fast accelerations and decelerations), and 20–30 minutes of match practice. During most of these actions, loading bones are under tensile, compressive, shear, bending, and torsional stress.18 These stresses may exceed the modelling threshold, resulting in activation of bone modelling and remodelling processes which increase bone strength by changing structural stiffness and/or bone mass and density.16–18
Participation in sports may also produce muscle hypertrophy.24 Hypertrophied muscles, in turn, may exert greater tension on bones, eliciting a greater osteotrophic response.16–18
Assessment of pubertal status
Tanner pubertal status was self evaluated, a method of recognised validity and reliability.25
Analysis of body composition
Bone, lean, and fat mass were measured using dual energy x ray absorptiometry (DXA) (QDR-1500, software version 7.10; Hologic Corp, Waltham, Massachusetts, USA). DXA equipment was calibrated using a lumbar spine phantom following the Hologic guidelines. Subjects were scanned in the supine position. Scans were performed at high resolution. Lean mass (g), fat mass (g), and BMC (g) were calculated from the whole body scan.
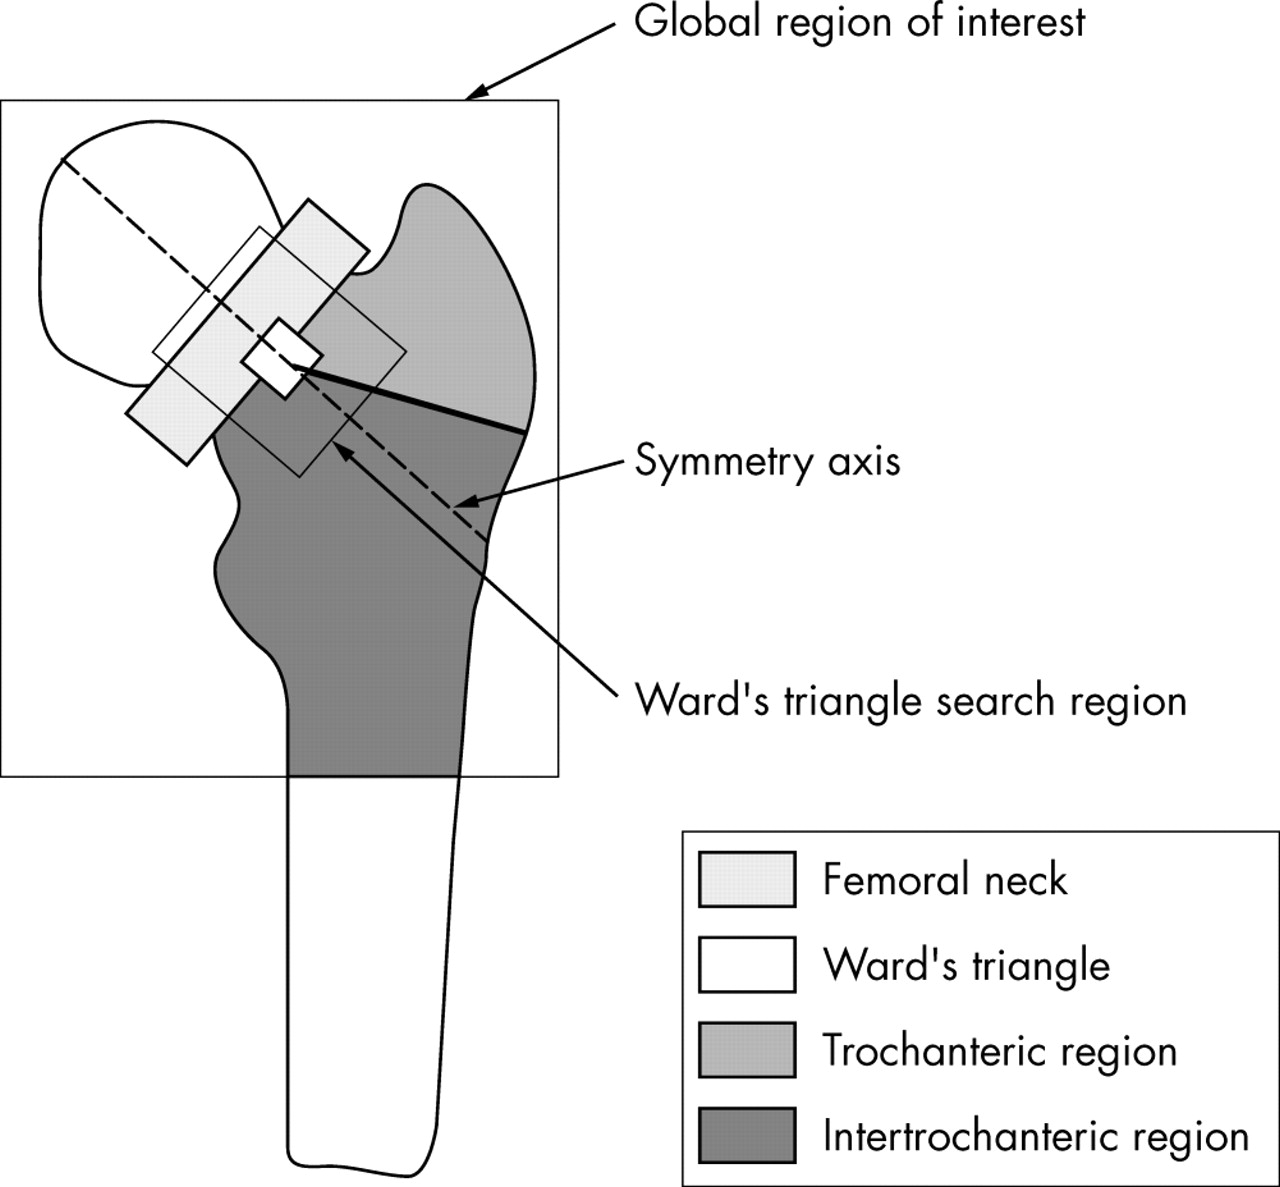
A specific examination was conducted to estimate bone mass at the proximal region of the femur. Briefly, the laser dot was placed on the subject’s thigh in front of the greater trochanter. The subject was instructed to remain still. Only the scanned images, including the entire femoral head, along with the greater and lesser trochanters, were further processed according to the instructions in the Hologic software manual. Figure 1 shows the regions of interest defined for the femoral neck, greater trochanter, intertrochanter, and Ward’s triangle. The analysis was accomplished by finding a symmetry axis in the femoral neck called the femoral midline. The femoral neck box (approximately 1.5 cm high and 4.1 cm wide) is centred in the narrowest point of the femoral neck, perpendicular to the midline. The Ward’s triangle is defined as a square (about 1 cm2) of minimal density within a search region of 2.7 cm by 3.5 cm, centred on the intersection of the lower edge of the femoral neck box with the midline. This intersection is also the starting point of a line drawn to the base of the trochanter, outlining the trochanteric region of interest. BMC (g) and BMD (g/cm2) for the femoral neck, greater trochanter, intertrochanter, and Ward’s triangle subregions were recorded. BMD was calculated using the formula BMD = BMC/area.

Diagram of the proximal femur dual energy x ray absorptiometry analysis, showing the global region of interest and subregions analysed.
Statistical analysis
Means (SD) are given as descriptive statistics. Differences between groups were established using Student’s unpaired t test. Analysis of covariance was performed to evaluate differences in bone mass, with the increment in height and body mass, age, and final age as covariates. The use of these covariates is based on evidence identifying height, age, and body mass as influential factors on the growing skeleton.26 Final age was included as a covariate because the length of the follow up period was not exactly the same in all subjects. Bivariate correlation and linear stepwise multiple regression were also applied to identify the relation between lean mass or body mass and femoral bone mass variables. Standard error of the estimate (SEE) and 95% confidence intervals (CI) for the models are also reported. To test the similarity of slopes and intercepts of these relations, the corresponding t test was applied to the model:
Yij = αi + βiXij + εij
for i = 1,2 (1 = active subjects, 2 = controls) and j = 1,...,n1 being εij i.i.d. random variables following a distribution N(0,σ1). The SPSS 11.0 package (SPSS Inc, Chicago, Illinois, USA) for PCs was used for the statistical analysis. Significant differences were assumed when p<0.05. The power and size of the significant effects ranged between 0.58 and 0.98 for power, and between 0.18 and 0.43 for size.
RESULTS
Physical characteristics of the subjects
Age and anthropometric data were comparable at baseline and 3.3 years later (table 1). Tanner status was also similar in the two groups at baseline (1–2) and at the end of the survey (3–4).
Characteristics, total bone mineral content and areal density (BMC and BMD), and intake of dairy calcium
Bone mass
Whole body BMC and BMD were similar in the two groups at baseline and at the end of follow up (table 1). However, the influence of sports participation on femoral BMC accrual was notable. At baseline, after adjustment for age, height, and body mass, trochanteric BMC and femoral neck BMD were higher in the active than in the non-active boys (p<0.05; fig 2). However, BMC in the intertrochanteric zone was lower in the active than in the non-active boys (p<0.05; fig 2). However, the increase in femoral neck and intertrochanteric BMC in the active boys was twice that of the control group, which resulted in a two times greater increase in total proximal femur BMC of the active boys (p<0.05; fig 2). The increase in femoral BMD in the active group was also twice that of the controls because of a greater increase in BMD in all the regions studied (9–19%, p<0.05; fig 2).

Femoral bone mass. (A) Age, height, and body mass adjusted total proximal femur bone mineral content (BMC) and areal density (BMD) at baseline. (B) Increments in BMC and BMD after 3.3 years in the whole femur and femoral regions after adjustment for the increase in age, height, and body mass. Bars represent the mean (SD); the corresponding 95% confidence intervals are displayed in parentheses. *p<0.05; †p = 0.06.
The greatest correlation was found between both total femoral BMC (fig 3) and BMD increment and lean mass increment (r = 0.67 and r = 0.69 respectively; p<0.001). A close correlation was also observed between the increment in femoral bone mass variables and total body mass enhancement (r = 0.54–0.65, p<0.005). In contrast, no correlation was found between the increment in fat mass and bone mass enhancement.

Relation between the increase in bone mineral content (BMC) and the increase in total body lean mass. CI, Confidence interval.
Femoral BMC and BMD increments were regressed on to lean mass, fat mass, and total body mass. As no significant differences in slopes or intercepts were observed between the groups, they were combined into a single group for this analysis. The multiple regression analysis showed that lean mass was the variable with the highest predictive value for both femoral BMC and BMD increments, explaining 43% and 48% of the variation respectively, as reflected in the following equations:
Δfemoral BMC = 1.21ΔLM + 2.55 (R = 0.65, p<0.001, SEE = 23.8, 95% CI 0.44 to 0.82)
Δfemoral BMD = 0.374ΔLM – 2.19 (R = 0.69, p<0.001, SEE = 6.6, 95% CI 0.47 to 0.83)
where LM is lean mass.
DISCUSSION
Two major findings emerge from this study. Firstly, early pubertal boys who participated in extracurricular sports for three hours a week over a three year period increased their femoral BMC and BMD more than their non-physically active matched counterparts. Secondly, lean mass development was the best predictor of femoral BMC and BMD, whereas the increment in fat mass did not show any relation to bone mass development.
Some animal and human studies have found that exercise induced bone benefits are greater when the exercise is continued throughout the pubertal years, possibly because of the responsiveness of immature bone to mechanical stimulation.27 The results of this investigation accord well with these studies, reflecting that boys participating in extracurricular sports over three years, starting at a prepubertal age, have appreciably greater bone mass accumulation in the femoral zone than their non-active counterparts. This is important because epidemiological studies suggest that even a small increment in femoral neck BMD is associated with a high reduction in the risk of hip fracture in older adults.28 However, changes in areal BMD are not always associated with better architectural indices of bone mechanical resistance.19
Courteix et al29 investigated the influence of body composition on bone mass using DXA to estimate bone, lean, and fat mass. We are not aware of any longitudinal investigation of the relation between body composition and femoral bone mass development in prepubertal and peripubertal boys. Our results show that the increase in lean mass is a better predictor of the enhancement of femoral BMC and BMD than fat mass or total body mass during growth. In agreement, Rauch et al12 reported that, in the lower extremities, peak BMC accrual occurred 0.48 years after the maximal increase in total lean mass, suggesting that the greater stimulus elicited by a larger muscle mass contributed to this enhancement in peak BMC accrual.
As expected, the increase in total body mass also correlated with femoral bone mass development, but this relation was weaker than that between lean mass and femoral bone mass variables. The fat component of body mass has been found to be independently related to BMC in children.23 Obesity has been found to be associated with increased BMD in adults.30 However, we found no relation between changes in fat mass with the increase in bone mass observed with growth in peripubertal boys. Despite the potentially protective value of fat accumulation for bone health, our results indicate that, during growth, it is more important to increase lean mass than fat mass to promote femoral bone mass acquisition. In spite of this different effect of lean and fat mass enhancement on bone mass accretion, it remains to be determined if a reduction in fat mass, as for example in overweight boys being treated for their weight problems, has the reverse effect on bone mass. Our data suggest that, if lean mass (muscle mass) is maintained during body mass reduction, femoral bone mass will probably not be negatively affected. However, this requires a specific study.
We have recently observed that sports participation increases lean mass and bone mass in prepubertal boys.6 However, femoral neck BMC and BMD did not correlate with either lean mass or total body mass. In addition, despite these linear relations, total femoral and greater trochanter BMC and BMD in all regions studied were greater in the active group than in control subjects, even after accounting for differences in lean mass. This implies that additional factors apart from lean mass accrual account for the differences encountered in femoral BMC and BMD in physically active children.
Limitations of the study
DXA scanners are not able to measure real BMD or volumetric bone mineral density (vBMD, usually expressed in g/cm3); what they measure is areal bone mineral density (g/cm2). Bone consists of the mineralised matrix distributed into a cortical shell and a trabecular network of plates within a marrow cavity. The x ray photons are mainly attenuated by the mineralised component of the bone structure, such that BMC is proportional to the degree of photon attenuation. However, differences in the content of fat in the marrow or the tissues above, below, or around the bones measured may alter the results.32 In our investigation, only small changes were observed in soft tissue composition with growth, implying that this limitation was probably minor. The image produced during scanning is two dimensional, as it consists of the shadow or silhouette of the projected area occupied by bones, whereas bones are three dimensional. This implies that only two dimensions—that is, the length and width—of the scanned bone are being determined during the scan, and the depth remains unknown. Bones with greater depth attenuate more photons and will be reported as having a greater BMD. The depth of bones has a negligible effect on the assessment of BMC. However, of two bones with similar projected area, the one with the greatest depth will be reported as having a higher areal BMD, despite the fact that volumetric density may be similar or even lower in the bone with more depth (see the excellent review by E Seeman on this topic,31 and the paper by Bolotin and Sievanen32). During growth not only the bone area but also the depth of the bones increases. This means that, during growth, areal BMD will be reported as increasing whereas the real vBMD remains almost unchanged.33 To circumvent these limitations, the effect of body size on areal BMD determinations was taken into account after adjustment for body mass, height, age, and final age. In addition, the effect of sports participation was determined by comparing the increments observed in femoral areal BMD in the active group with those observed in the control group. As the two groups were of similar height and weight at the start of the study and the end of the follow up, we can rule out any confounding effect of the increase in bone size on the effects of sports participation on areal BMD.
What is already known on this topic
Exercise, particularly when it includes high impact loads, is associated with enhanced bone mass accretion during growth. Cross sectional studies have reported a close correlation between body mass, in particular lean mass, and bone mass throughout life.
What this study adds
Lean mass development is the best predictor of femoral bone mass accrual in peripubertal boys. Children who devote at least three hours a week to recreational sports participation accrue femoral bone mass and density at a much greater rate than their less active counterparts.
CONCLUSION
Our findings establish lean mass increment as an important predictor of femoral bone mineral mass accumulation during pubertal growth. As lean mass is composed primarily of skeletal muscle, sports participation during puberty may not only have a direct osteogenic effect by impact loading but also an indirect effect by increasing muscle mass. Bigger muscles develop greater force, inducing more intense mechanical stimulation of the bones to which they are attached. Further studies are necessary to clarify which kinds of sport are best suited to facilitate gains in both bone mass and muscle mass in boys. Our data suggest that a positive effect can be obtained in children who participate in at least three hours of extramural sports activities a week.
Acknowledgments
The study was supported by Ministerio de Educación, Cultura y Deportes (AP2000-3652), Universidad de Las Palmas de Gran Canaria, Gobierno de Canarias (PI2000/067), Consejo Superior de Deportes (27/UNI10/00) and Ministerio de Ciencia y Tecnología (BFI2003-09638 and FEDER). We thank José Navarro de Tuero for excellent technical assistance.
REFERENCES
Footnotes
-
Competing interests: none declared
Linked Articles
- Correction